Long-term COVID-19 complications are a globally pervasive threat, but their plausible social drivers are often not prioritized. Here, we use data from a multinational consortium to quantify the relative contributions of social and clinical factors to differences in quality of life among participants experiencing long COVID and measure the extent to which social variables’ impacts can be attributed to clinical intermediates, across diverse contexts. In addition to age, neuropsychological and rheumatological comorbidities, educational attainment, employment status, and female sex were identified as important predictors of long COVID-associated quality of life days (long COVID QALDs). Furthermore, a great majority of their impacts on long COVID QALDs could not be tied to key long COVID-predicting comorbidities, such as asthma, diabetes, hypertension, psychological disorder, and obesity. In Norway, 90% (95% CI: 77%, 100%) of the effect of belonging to the highest versus lowest educational attainment quintile was not attributed to intermediate comorbidity impacts. The same was true for 86% (73%, 100%) of the protective effects of full-time employment versus all other employment status categories (excluding retirement) in the UK and 74% (46%,100%) of the protective effects of full-time employment versus all other employment status categories in a cohort of four middle-income countries (MIC). Of the effects of female sex on long COVID QALDs in Norway, UK, and the MIC cohort, 77% (46%,100%), 73% (52%, 94%), and 84% (62%, 100%) were unexplained by the clinical mediators, respectively. Our findings highlight that socio-economic proxies and sex may be as predictive of long COVID QALDs as commonly emphasized comorbidities and that broader structural determinants likely drive their impacts. Importantly, we outline a multi-method, adaptable causal machine learning approach for evaluating the isolated contributions of social disparities to long COVID quality of life experiences.
ImportanceThe frequent occurrence of cognitive symptoms in post–COVID-19 condition has been described, but the nature of these symptoms and their demographic and functional factors are not well characterized in generalizable populations. ObjectiveTo investigate the prevalence of self-reported cognitive symptoms in post–COVID-19 condition, in comparison with individuals with prior acute SARS-CoV-2 infection who did not develop post–COVID-19 condition, and their association with other individual features, including depressive symptoms and functional status. Design, Setting, and ParticipantsTwo waves of a 50-state nonprobability population-based internet survey conducted between December 22, 2022, and May 5, 2023. Participants included survey respondents aged 18 years and older. ExposurePost–COVID-19 condition, defined as self-report of symptoms attributed to COVID-19 beyond 2 months after the initial month of illness. Main Outcomes and MeasuresSeven items from the Neuro-QoL cognition battery assessing the frequency of cognitive symptoms in the past week and patient Health Questionnaire-9. ResultsThe 14 767 individuals reporting test-confirmed COVID-19 illness at least 2 months before the survey had a mean (SD) age of 44.6 (16.3) years; 568 (3.8%) were Asian, 1484 (10.0%) were Black, 1408 (9.5%) were Hispanic, and 10 811 (73.2%) were White. A total of 10 037 respondents (68.0%) were women and 4730 (32.0%) were men. Of the 1683 individuals reporting post–COVID-19 condition, 955 (56.7%) reported at least 1 cognitive symptom experienced daily, compared with 3552 of 13 084 (27.1%) of those who did not report post–COVID-19 condition. More daily cognitive symptoms were associated with a greater likelihood of reporting at least moderate interference with functioning (unadjusted odds ratio [OR], 1.31 [95% CI, 1.25-1.36]; adjusted [AOR], 1.30 [95% CI, 1.25-1.36]), lesser likelihood of full-time employment (unadjusted OR, 0.95 [95% CI, 0.91-0.99]; AOR, 0.92 [95% CI, 0.88-0.96]) and greater severity of depressive symptoms (unadjusted coefficient, 1.40 [95% CI, 1.29-1.51]; adjusted coefficient 1.27 [95% CI, 1.17-1.38). After including depressive symptoms in regression models, associations were also found between cognitive symptoms and at least moderate interference with everyday functioning (AOR, 1.27 [95% CI, 1.21-1.33]) and between cognitive symptoms and lower odds of full-time employment (AOR, 0.92 [95% CI, 0.88-0.97]). Conclusions and RelevanceThe findings of this survey study of US adults suggest that cognitive symptoms are common among individuals with post–COVID-19 condition and associated with greater self-reported functional impairment, lesser likelihood of full-time employment, and greater depressive symptom severity. Screening for and addressing cognitive symptoms is an important component of the public health response to post–COVID-19 condition.
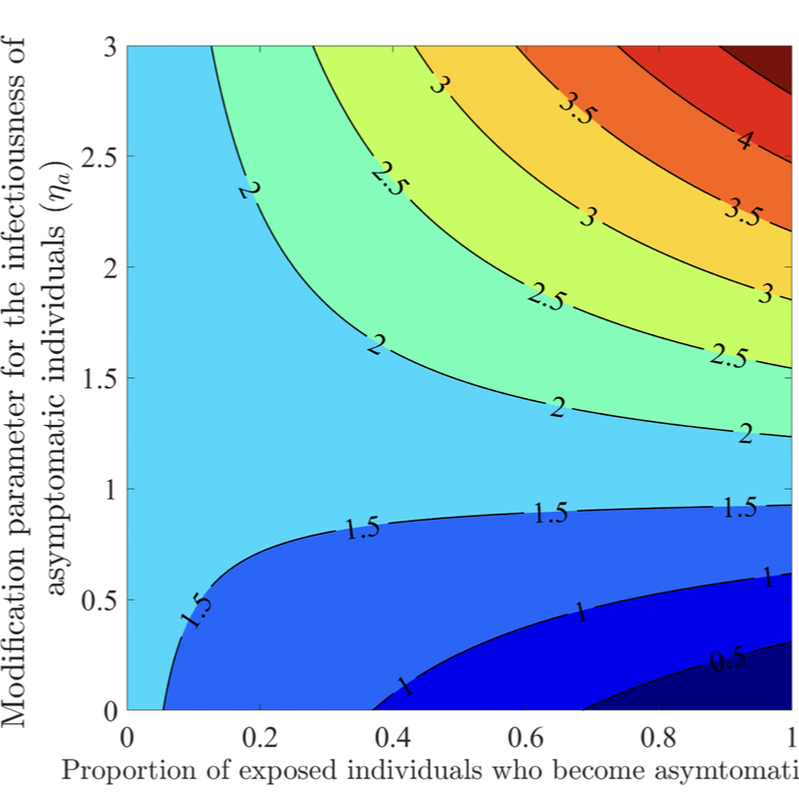
The COVID-19 pandemic has not only presented a major global public health and socio-economic crisis, but has also significantly impacted human behavior towards adherence (or lack thereof) to public health intervention and mitigation measures implemented in communities worldwide. The dynamic nature of the pandemic has prompted extensive changes in individual and collective behaviors towards the pandemic. This study is based on the use of mathematical modeling approaches to assess the extent to which SARS-CoV-2 transmission dynamics is impacted by population-level changes of human behavior due to factors such as (a) the severity of transmission (such as disease-induced mortality and level of symptomatic transmission), (b) fatigue due to the implementation of mitigation interventions measures (e.g., lockdowns) over a long (extended) period of time, (c) social peer-pressure, among others. A novel behavior-epidemiology model, which takes the form of a deterministic system of nonlinear differential equations, is developed and fitted using observed cumulative SARS-CoV-2 mortality data during the first wave in the United States. Rigorous analysis of the model shows that its disease-free equilibrium is locally-asymptotically stable whenever a certain epidemiological threshold, known as the control reproduction number (denoted by RC ) is less than one, and the disease persists (i.e., causes significant outbreak or outbreaks) if the threshold exceeds one. The model fits the observed data, as well as makes a more accurate prediction of the observed daily SARS-CoV-2 mortality during the first wave (March 2020 -June 2020), in comparison to the equivalent model which does not explicitly account for changes in human behavior. Of the various metrics for human behavior changes during the pandemic considered in this study, it is shown that behavior changes due to the level of SARS-CoV-2 mortality and symptomatic transmission were more influential (while behavioral changes due to the level of fatigue to interventions in the community was of marginal impact). It is shown that an increase in the proportion of exposed individuals who become asymptomatically-infectious at the end of the exposed period (represented by a parameter r) can lead to an increase (decrease) in the control reproduction number (RC) if the effective contact rate of asymptomatic individuals is higher (lower) than that of symptomatic individuals. The study identifies two threshold values of the parameter r that maximize the cumulative and daily SARS-CoV-2 mortality, respectively, during the first wave. Furthermore, it is shown that, as the value of the proportion r increases from 0 to 1, the rate at which susceptible non-adherent individuals change their behavior to strictly adhere to public health interventions decreases. Hence, this study suggests that, as more newly- infected individuals become asymptomatically-infectious, the level of positive behavior change, as well as disease severity, hospitalizations and disease-induced mortality in the community can be expected to significantly decrease (while new cases may rise, particularly if asymptomatic individuals have higher contact rate, in comparison to symptomatic individuals).
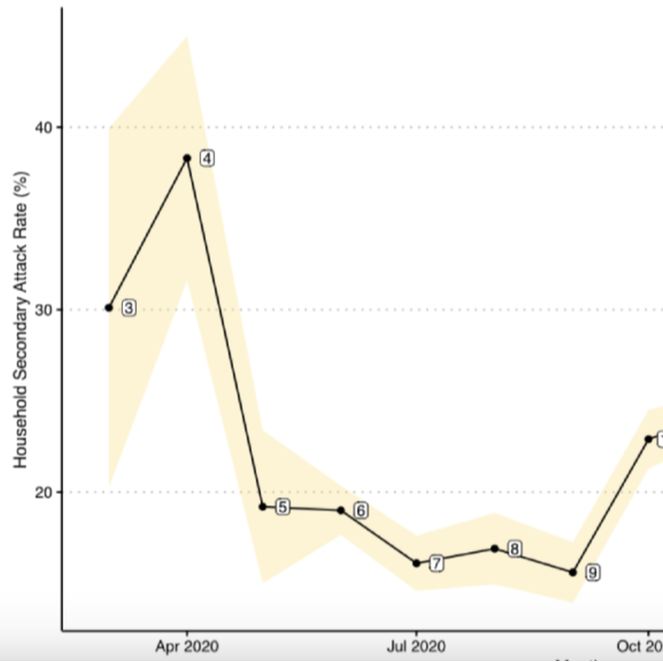
Background: The correlates responsible for the temporal changes of intrahousehold SARS-CoV-2 transmission in the United States have been understudied mainly due to a lack of available surveillance data. Specifically, early analyses of SARS-CoV-2 household secondary attack rates (SARs) were small in sample size and conducted cross-sectionally at single time points. From these limited data, it has been difficult to assess the role that different risk factors have had on intrahousehold disease transmission in different stages of the ongoing COVID-19 pandemic, particularly in children and youth. Objective: This study aimed to estimate the transmission dynamic and infectivity of SARS-CoV-2 among pediatric and young adult index cases (age 0 to 25 years) in the United States through the initial waves of the pandemic. Methods: Using administrative claims, we analyzed 19 million SARS-CoV-2 test records between January 2020 and February 2021. We identified 36,241 households with pediatric index cases and calculated household SARs utilizing complete case information. Using a retrospective cohort design, we estimated the household SARS-CoV-2 transmission between 4 index age groups (0 to 4 years, 5 to 11 years, 12 to 17 years, and 18 to 25 years) while adjusting for sex, family size, quarter of first SARS-CoV-2 positive record, and residential regions of the index cases. Results: After filtering all household records for greater than one member in a household and missing information, only 36,241 (0.85%) of 4,270,130 households with a pediatric case remained in the analysis. Index cases aged between 0 and 17 years were a minority of the total index cases (n=11,484, 11%). The overall SAR of SARS-CoV-2 was 23.04% (95% CI 21.88-24.19). As a comparison, the SAR for all ages (0 to 65+ years) was 32.4% (95% CI 32.1-32.8), higher than the SAR for the population between 0 and 25 years of age. The highest SAR of 38.3% was observed in April 2020 (95% CI 31.6-45), while the lowest SAR of 15.6% was observed in September 2020 (95% CI 13.9-17.3). It consistently decreased from 32% to 21.1% as the age of index groups increased. In a multiple logistic regression analysis, we found that the youngest pediatric age group (0 to 4 years) had 1.69 times (95% CI 1.42-2.00) the odds of SARS-CoV-2 transmission to any family members when compared with the oldest group (18 to 25 years). Family size was significantly associated with household viral transmission (odds ratio 2.66, 95% CI 2.58-2.74). Conclusions: Using retrospective claims data, the pediatric index transmission of SARS-CoV-2 during the initial waves of the COVID-19 pandemic in the United States was associated with location and family characteristics. Pediatric SAR (0 to 25 years) was less than the SAR for all age other groups. Less than 1% (n=36,241) of all household data were retained in the retrospective study for complete case analysis, perhaps biasing our findings. We have provided measures of baseline household pediatric transmission for tracking and comparing the infectivity of later SARS-CoV-2 variants.
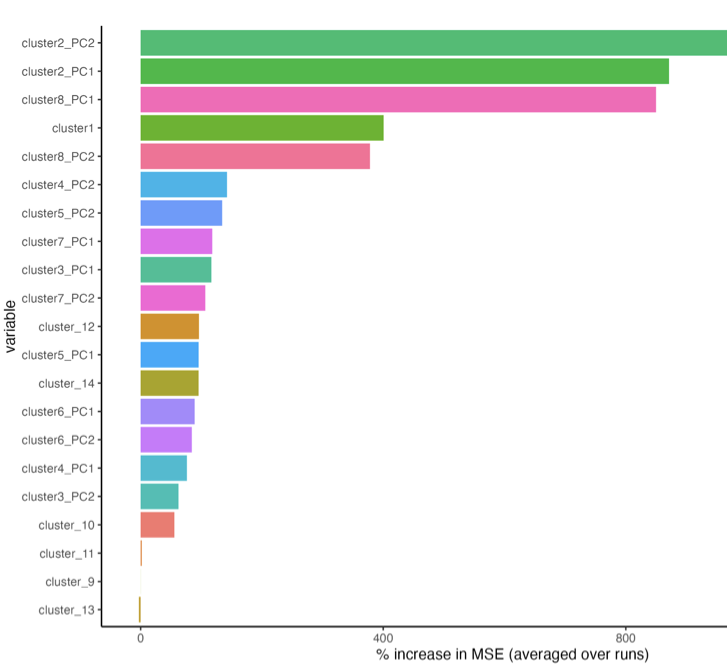
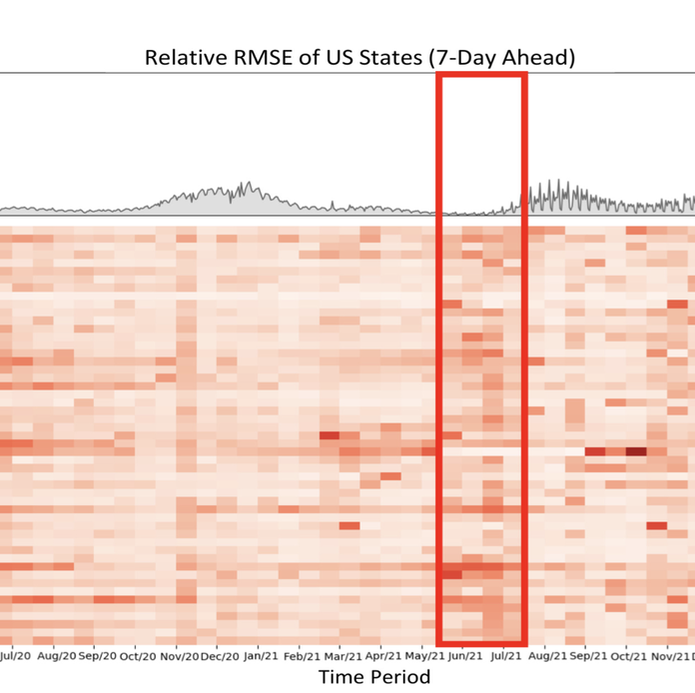
The coronavirus (COVID-19) pandemic has profoundly impacted various aspects of daily life, society, healthcare systems, and global health policies. This pandemic has resulted in more than one hundred million people being infected and, unfortunately, the loss of life for many individuals. Although treatment for the coronavirus is now available, effective forecasting of COVID-19 infec- tion is the most importance to aid public health officials in making critical decisions. However, forecasting COVID-19 trends through time-series analysis poses significant challenges due to the data’s inherently dynamic, transient, and noise-prone nature. In this study, we have developed the Fine-Grained Infection Forecast Network (FIGI-Net) model, which provides accurate forecasts of COVID-19 trends up to two weeks in advance. FIGI-Net addresses the current limitations in COVID-19 forecasting by leveraging fine-grained county-level data and a stacked bidirectional LSTM structure. We employ a pre-trained model to capture essential global infection patterns. Subsequently, these pre-trained parameters were transferred to train localized sub-models for county clusters exhibiting comparable infection dynamics. This model adeptly handles sudden changes and rapid fluctuations in data, frequently observed across various times and locations of county-level data, ultimately improving the accuracy of COVID-19 infection forecasting at the county, state, and national levels. FIGI-Net model demonstrated significant improvement over other deep learning-based models and state-of-the-art COVID-19 forecasting models, evident in various standard evaluation metrics. Notably, FIGI-Net model excels at forecasting the direction of infection trends, especially during the initial phases of different COVID-19 outbreak waves. Our study underscores the effectiveness and superiority of our time-series deep learning-based methods in addressing dynamic and sudden changes in infection numbers over short-term time periods. These capabilities facilitate efficient public health management and the early implementation of COVID-19 transmission prevention measures.