Research |
Characterizing Disease Outbreaks and Pandemic Preparedness
|
Catastrophic epidemics, when they occur, typically start from localized and far smaller (non-catastrophic) outbreaks that grow into much greater threats. One key bulwark against this outcome is the ability of governments and the health sector more generally to make informed decisions about control measures based on accurate understanding of the current and future extent of the outbreak. Our team works in the design of mathematical strategies to provide decision makers and public health officials with high-quality situation reporting, by providing real-time estimates of key epidemiological quantities (cumulative incidence, effective reproductive number, the likelihood that an outbreak will occur in the near future in a given location) to help them make informed decisions, leveraging traditional and novel data sources.
|
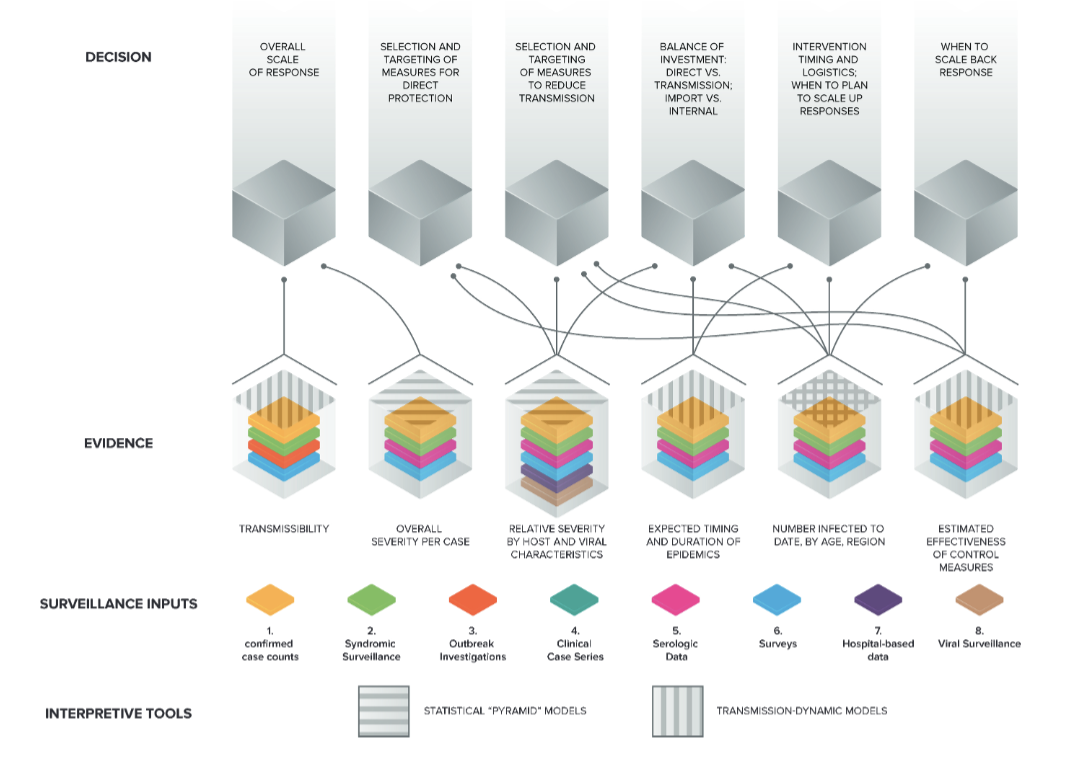
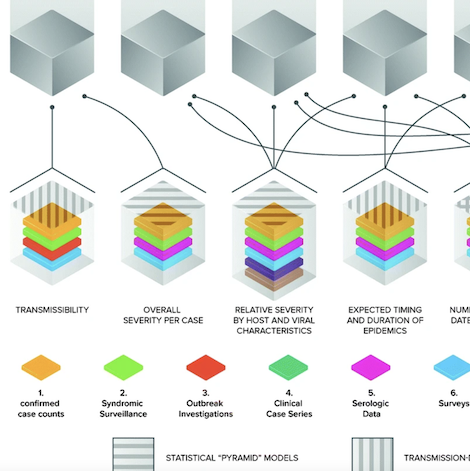
Figure Key decisions on pandemic response and the evidence base on which they ideally rest; this evidence base is built up from surveillance inputs using interpretive tools such as transmission-dynamic models and “pyramid”severity models. Image adapted from Lipsitch et al. (2011) by Lucia Ricci
|
Related publications
|
Mathematical assessment of the role of human behavior changes on SARS-CoV-2 transmission dynamics
Binod Pant, Salman Safdar, Mauricio Santillana, and Abba B. Gumel. medRxiv. doi: https://doi.org/10.1101/2024.02.11.24302662 Abstract
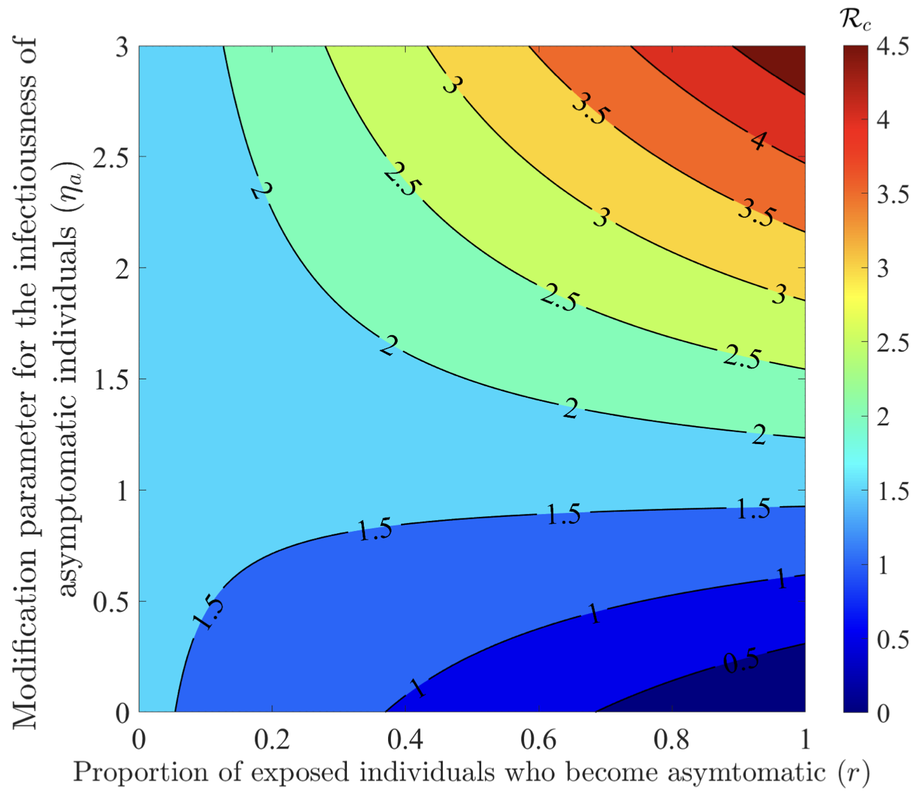
The COVID-19 pandemic has not only presented a major global public health and socio-economic crisis, but has also significantly impacted human behavior towards adherence (or lack thereof) to public health intervention and mitigation measures implemented in communities worldwide. The dynamic nature of the pandemic has prompted extensive changes in individual and collective behaviors towards the pandemic. This study is based on the use of mathematical modeling approaches to assess the extent to which SARS-CoV-2 transmission dynamics is impacted by population-level changes of human behavior due to factors such as (a) the severity of transmission (such as disease-induced mortality and level of symptomatic transmission), (b) fatigue due to the implementation of mitigation interventions measures (e.g., lockdowns) over a long (extended) period of time, (c) social peer-pressure, among others. A novel behavior-epidemiology model, which takes the form of a deterministic system of nonlinear differential equations, is developed and fitted using observed cumulative SARS-CoV-2 mortality data during the first wave in the United States. Rigorous analysis of the model shows that its disease-free equilibrium is locally-asymptotically stable whenever a certain epidemiological threshold, known as the control reproduction number (denoted by RC ) is less than one, and the disease persists (i.e., causes significant outbreak or outbreaks) if the threshold exceeds one. The model fits the observed data, as well as makes a more accurate prediction of the observed daily SARS-CoV-2 mortality during the first wave (March 2020 -June 2020), in comparison to the equivalent model which does not explicitly account for changes in human behavior. Of the various metrics for human behavior changes during the pandemic considered in this study, it is shown that behavior changes due to the level of SARS-CoV-2 mortality and symptomatic transmission were more influential (while behavioral changes due to the level of fatigue to interventions in the community was of marginal impact). It is shown that an increase in the proportion of exposed individuals who become asymptomatically-infectious at the end of the exposed period (represented by a parameter r) can lead to an increase (decrease) in the control reproduction number (RC) if the effective contact rate of asymptomatic individuals is higher (lower) than that of symptomatic individuals. The study identifies two threshold values of the parameter r that maximize the cumulative and daily SARS-CoV-2 mortality, respectively, during the first wave. Furthermore, it is shown that, as the value of the proportion r increases from 0 to 1, the rate at which susceptible non-adherent individuals change their behavior to strictly adhere to public health interventions decreases. Hence, this study suggests that, as more newly- infected individuals become asymptomatically-infectious, the level of positive behavior change, as well as disease severity, hospitalizations and disease-induced mortality in the community can be expected to significantly decrease (while new cases may rise, particularly if asymptomatic individuals have higher contact rate, in comparison to symptomatic individuals). |
|
Pediatric and Young Adult Household Transmission of the Initial Waves of SARS-CoV-2 in the United States: Administrative Claims Study
Ming Kei Chung, Brian Hart, Mauricio Santillana, Chirag J Patel. Journal of Medical Internet Research 2024; 26:e44249 Abstract
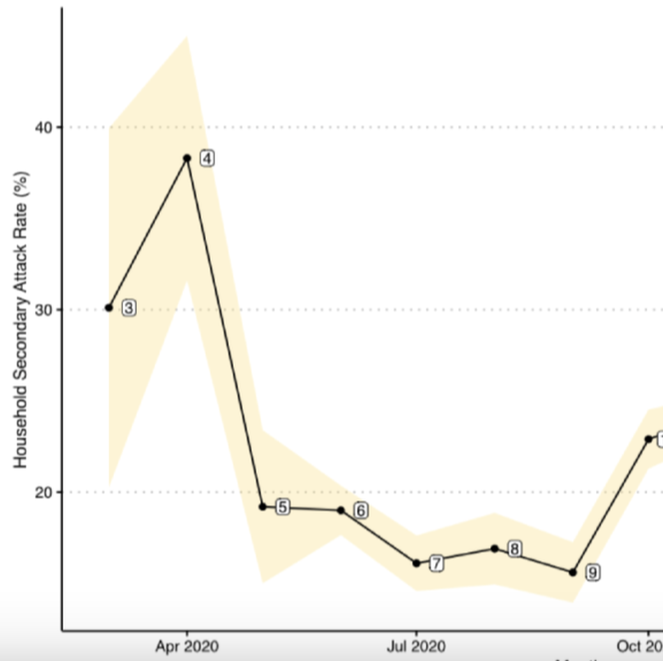
Background: The correlates responsible for the temporal changes of intrahousehold SARS-CoV-2 transmission in the United States have been understudied mainly due to a lack of available surveillance data. Specifically, early analyses of SARS-CoV-2 household secondary attack rates (SARs) were small in sample size and conducted cross-sectionally at single time points. From these limited data, it has been difficult to assess the role that different risk factors have had on intrahousehold disease transmission in different stages of the ongoing COVID-19 pandemic, particularly in children and youth. Objective: This study aimed to estimate the transmission dynamic and infectivity of SARS-CoV-2 among pediatric and young adult index cases (age 0 to 25 years) in the United States through the initial waves of the pandemic. Methods: Using administrative claims, we analyzed 19 million SARS-CoV-2 test records between January 2020 and February 2021. We identified 36,241 households with pediatric index cases and calculated household SARs utilizing complete case information. Using a retrospective cohort design, we estimated the household SARS-CoV-2 transmission between 4 index age groups (0 to 4 years, 5 to 11 years, 12 to 17 years, and 18 to 25 years) while adjusting for sex, family size, quarter of first SARS-CoV-2 positive record, and residential regions of the index cases. Results: After filtering all household records for greater than one member in a household and missing information, only 36,241 (0.85%) of 4,270,130 households with a pediatric case remained in the analysis. Index cases aged between 0 and 17 years were a minority of the total index cases (n=11,484, 11%). The overall SAR of SARS-CoV-2 was 23.04% (95% CI 21.88-24.19). As a comparison, the SAR for all ages (0 to 65+ years) was 32.4% (95% CI 32.1-32.8), higher than the SAR for the population between 0 and 25 years of age. The highest SAR of 38.3% was observed in April 2020 (95% CI 31.6-45), while the lowest SAR of 15.6% was observed in September 2020 (95% CI 13.9-17.3). It consistently decreased from 32% to 21.1% as the age of index groups increased. In a multiple logistic regression analysis, we found that the youngest pediatric age group (0 to 4 years) had 1.69 times (95% CI 1.42-2.00) the odds of SARS-CoV-2 transmission to any family members when compared with the oldest group (18 to 25 years). Family size was significantly associated with household viral transmission (odds ratio 2.66, 95% CI 2.58-2.74). Conclusions: Using retrospective claims data, the pediatric index transmission of SARS-CoV-2 during the initial waves of the COVID-19 pandemic in the United States was associated with location and family characteristics. Pediatric SAR (0 to 25 years) was less than the SAR for all age other groups. Less than 1% (n=36,241) of all household data were retained in the retrospective study for complete case analysis, perhaps biasing our findings. We have provided measures of baseline household pediatric transmission for tracking and comparing the infectivity of later SARS-CoV-2 variants. |
|
Fine-Grained Forecasting of COVID-19 Trends at the County Level in the United States
Tzu-Hsi Songa, Leonardo Clemente, Xiang Pana, Junbong Janga, Mauricio Santillanab, and Kwonmoo Leea. medRxiv. doi: https://doi.org/10.1101/2024.01.13.24301248 Abstract
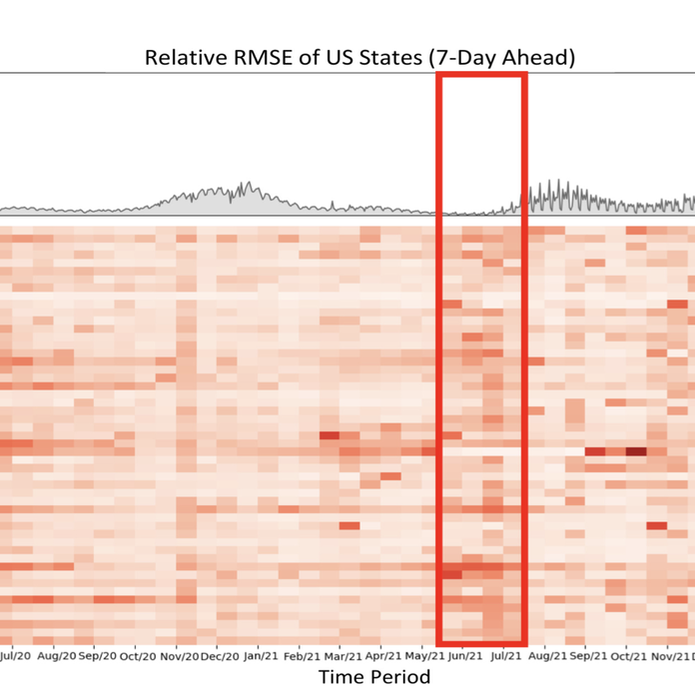
The coronavirus (COVID-19) pandemic has profoundly impacted various aspects of daily life, society, healthcare systems, and global health policies. This pandemic has resulted in more than one hundred million people being infected and, unfortunately, the loss of life for many individuals. Although treatment for the coronavirus is now available, effective forecasting of COVID-19 infec- tion is the most importance to aid public health officials in making critical decisions. However, forecasting COVID-19 trends through time-series analysis poses significant challenges due to the data’s inherently dynamic, transient, and noise-prone nature. In this study, we have developed the Fine-Grained Infection Forecast Network (FIGI-Net) model, which provides accurate forecasts of COVID-19 trends up to two weeks in advance. FIGI-Net addresses the current limitations in COVID-19 forecasting by leveraging fine-grained county-level data and a stacked bidirectional LSTM structure. We employ a pre-trained model to capture essential global infection patterns. Subsequently, these pre-trained parameters were transferred to train localized sub-models for county clusters exhibiting comparable infection dynamics. This model adeptly handles sudden changes and rapid fluctuations in data, frequently observed across various times and locations of county-level data, ultimately improving the accuracy of COVID-19 infection forecasting at the county, state, and national levels. FIGI-Net model demonstrated significant improvement over other deep learning-based models and state-of-the-art COVID-19 forecasting models, evident in various standard evaluation metrics. Notably, FIGI-Net model excels at forecasting the direction of infection trends, especially during the initial phases of different COVID-19 outbreak waves. Our study underscores the effectiveness and superiority of our time-series deep learning-based methods in addressing dynamic and sudden changes in infection numbers over short-term time periods. These capabilities facilitate efficient public health management and the early implementation of COVID-19 transmission prevention measures. |
|
Enhancing Situational Awareness to Prevent Infectious Disease Outbreaks from Becoming Catastrophic
Lipsitch M, Santillana M. In: Inglesby T Global Catastrophic Biological Risk. Current Topics in Microbiology and Immunology. Springer, Berlin, Heidelberg. ; 2019. Abstract
Catastrophic epidemics, if they occur, will very likely start from localized and far smaller (noncatastrophic) outbreaks that grow into much greater threats. One key bulwark against this outcome is the ability of governments and the health sector more generally to make informed decisions about control measures based on accurate understanding of the current and future extent of the outbreak. Situation reporting is the activity of periodically summarizing the state of the outbreak in a (usually) public way. We delineate key classes of decisions whose quality depends on high-quality situation reporting, key quantities for which estimates are needed to inform these decisions, and the traditional and novel sources of data that can aid in estimating these quantities. We emphasize the important role of situation reports as providing public, shared planning assumptions that allow decision makers to harmonize the response while making explicit the uncertainties that underlie the scenarios outlined for planning. In this era of multiple data sources and complex factors informing the interpretation of these data sources, we describe four principles for situation reporting:1. Situation reporting should be thematic, concentrating on essential areas of evidence needed for decisions. 2. Situation reports should adduce evidence from multiple sources to address each area of evidence, along with expert assessments of key parameters. 3. Situation reports should acknowledge uncertainty and attempt to estimate its magnitude for each assessment.4. Situation reports should contain carefully curated visualizations along with text and tables. |
|
Patients with Cancer Appear More Vulnerable to SARS-CoV-2: A Multi-Center Study During the COVID-19 Outbreak
Dai M-Y, Liu D, Liu M, Zhou F-X, .., Mucci LA, Santillana M, Cai H-B. Cancer Discovery. 2020;DOI: 10.1158/2159-8290.CD-20-0422. Abstract
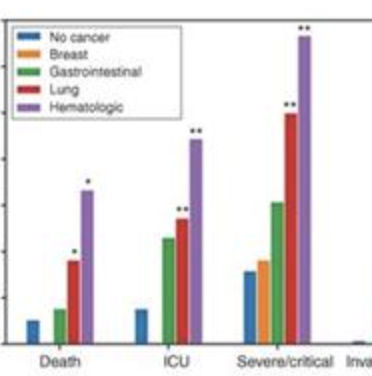
The novel COVID-19 outbreak has affected more than 200 countries and territories as of March 2020. Given that patients with cancer are generally more vulnerable to infections, systematic analysis of diverse cohorts of patients with cancer affected by COVID-19 is needed. We performed a multicenter study including 105 patients with cancer and 536 age-matched noncancer patients confirmed with COVID-19. Our results showed COVID-19 patients with cancer had higher risks in all severe outcomes. Patients with hematologic cancer, lung cancer, or with metastatic cancer (stage IV) had the highest frequency of severe events. Patients with nonmetastatic cancer experienced similar frequencies of severe conditions to those observed in patients without cancer. Patients who received surgery had higher risks of having severe events, whereas patients who underwent only radiotherapy did not demonstrate significant differences in severe events when compared with patients without cancer. These findings indicate that patients with cancer appear more vulnerable to SARS-CoV-2 outbreak. |
|
Socioeconomic status determines COVID-19 incidence and related mortality in Santiago, Chile
Mena G, Martinez PP, Mahmud AS, Marquet PA, Buckee CO, Santillana M. Science. 2021 :eabg5298. Abstract
The COVID-19 crisis has exposed major inequalities between communities. Understanding the societal risk factors that make some groups particularly vulnerable is essential to ensure more effective interventions for this and future pandemics. Here, we focus on socioeconomic status as a risk factor. Although it is broadly understood that social and economic inequality has a negative impact on health outcomes, the mechanisms by which socioeconomic status affects disease outcomes remain unclear. These mechanisms can be mediated by a range of systemic structural factors, such as access to health care and economic safety nets. We address this gap by providing an in-depth characterization of disease incidence and mortality and their dependence on demographic and socioeconomic strata in Santiago, a highly segregated city and the capital of Chile. |
|
Effect of non-pharmaceutical interventions for containing the COVID-19 outbreak in China.
Lai S, Ruktanonchai NW, Zhou L, Prosper O, Luo W, Floyd JR, Wesolowski A, Santillana M, Zhang C, Du X, et al. Nature . 2020;https://doi.org/10.1038/s41586-020-2293-x. Abstract
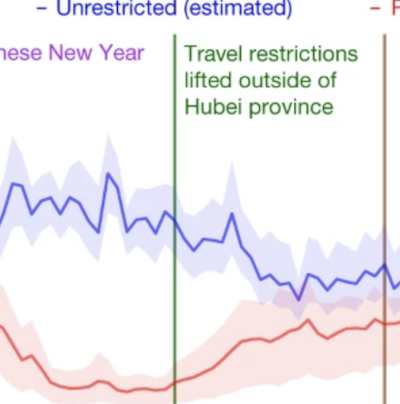
On 11 March 2020, the World Health Organization (WHO) declared coronavirus disease 2019 (COVID-19) a pandemic1. The strategies based on non-pharmaceutical interventions that were used to contain the outbreak in China appear to be effective2, but quantitative research is still needed to assess the efficacy of non-pharmaceutical interventions and their timings3. Here, using epidemiological data on COVID-19 and anonymized data on human movement4,5, we develop a modelling framework that uses daily travel networks to simulate different outbreak and intervention scenarios across China. We estimate that there were a total of 114,325 cases of COVID-19 (interquartile range 76,776–164,576) in mainland China as of 29 February 2020. Without non-pharmaceutical interventions, we predict that the number of cases would have been 67-fold higher (interquartile range 44–94-fold) by 29 February 2020, and we find that the effectiveness of different interventions varied. We estimate that early detection and isolation of cases prevented more infections than did travel restrictions and contact reductions, but that a combination of non-pharmaceutical interventions achieved the strongest and most rapid effect. According to our model, the lifting of travel restrictions from 17 February 2020 does not lead to an increase in cases across China if social distancing interventions can be maintained, even at a limited level of an on average 25% reduction in contact between individuals that continues until late April. These findings improve our understanding of the effects of non-pharmaceutical interventions on COVID-19, and will inform response efforts across the world. |
|
Estimating the cumulative incidence of COVID-19 in the United States using influenza surveillance, virologic testing, and mortality data: four complementary approaches
Lu FS, Nguyen AT, Link N, Molina M, Davis JT, Chinazzi M, Xiong X, Vespignani A, Lipsitch M, Santillana M. PLoS Computational Biology . 2021. Abstract
Effectively designing and evaluating public health responses to the ongoing COVID-19 pandemic requires accurate estimation of the prevalence of COVID-19 across the United States (US). Equipment shortages and varying testing capabilities have however hindered the usefulness of the official reported positive COVID-19 case counts. We introduce four complementary approaches to estimate the cumulative incidence of symptomatic COVID-19 in each state in the US as well as Puerto Rico and the District of Columbia, using a combination of excess influenza-like illness reports, COVID-19 test statistics, COVID-19 mortality reports, and a spatially structured epidemic model. Instead of relying on the estimate from a single data source or method that may be biased, we provide multiple estimates, each relying on different assumptions and data sources. Across our four approaches emerges the consistent conclusion that on April 4, 2020, the estimated case count was 5 to 50 times higher than the official positive test counts across the different states. Nationally, our estimates of COVID-19 symptomatic cases as of April 4 have a likely range of 2.3 to 4.8 million, with possibly as many as 7.6 million cases, up to 25 times greater than the cumulative confirmed cases of about 311,000. Extending our methods to May 16, 2020, we estimate that cumulative symptomatic incidence ranges from 4.9 to 10.1 million, as opposed to 1.5 million positive test counts. The proposed combination of approaches may prove useful in assessing the burden of COVID-19 during resurgences in the US and other countries with comparable surveillance systems. |
|
COVID-19: US Federal accountability for entry, spread, and inequities – lessons for the future
Hanage WP, Testa C, Chen JT, David L, Pechter E, Seminario P, Santillana M, Krieger N. European Journal of Epidemiology. 2020. Abstract
The United States (US) has been among those nations most severely affected by the first—and subsequent—phases of the pandemic of COVID-19, the disease caused by SARS-CoV-2. With only 4% of the worldwide population, the US has seen about 22% of COVID-19 deaths. Despite formidable advantages in resources and expertise, presently the per capita mortality rate is over 585/million, respectively 2.4 and 5 times higher compared to Canada and Germany. As we enter Fall 2020, the US is enduring ongoing outbreaks across large regions of the country. Moreover, within the US, an early and persistent feature of the pandemic has been the disproportionate impact on populations already made vulnerable by racism and dangerous jobs, inadequate wages, and unaffordable housing, and this is true for both the headline public health threat and the additional disastrous economic impacts. In this article we assess the impact of missteps by the Federal Government in three specific areas: the introduction of the virus to the US and the establishment of community transmission; the lack of national COVID-19 workplace standards and enforcement, and lack of personal protective equipment (PPE) for workplaces as represented by complaints to the Occupational Safety and Health Administration (OSHA) which we find are correlated with deaths 16 days later (ρ = 0.83); and the total excess deaths in 2020 to date already total more than 230,000, while COVID-19 mortality rates exhibit severe—and rising—inequities in race/ethnicity, including among working age adults. |
|
The Evolving Roles of US Political Partisanship and Social Vulnerability in the COVID-19 Pandemic from February 2020 - February 2021
J Kaashoek, C Testa, J Chen, L Stolerman, N Krieger, WP Hanage, and Mauricio Santillana Available at SSRN 3933453 Abstract
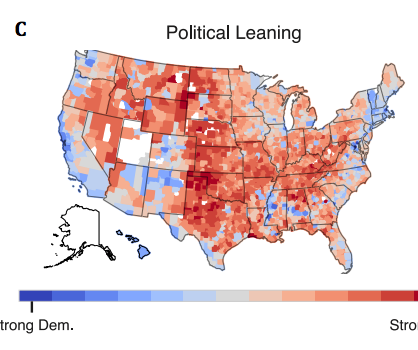
The COVID-19 pandemic has had intense, heterogeneous impacts on different communities and geographies in the United States. We explore county level associations between COVID-19 attributed deaths and social, demographic, vulnerability, and political variables to develop a better understanding of the evolving roles these variables play in relation to mortality. We focus on the role of political variables, as captured by support for either the Republican or Democrat presidential candidates in the 2020 elections and the stringency of state-wide governor mandates, during three non-overlapping time periods between February 2020 and February 2021. We find that during the first three months of the pandemic, Democratic-leaning and internationally-connected urban counties were affected. During subsequent months (between May and September, 2020), Republican counties with high percentages of Hispanic and Black populations were most hardly hit. Importantly, in the time period between October 2020 and February 2021, when the effectiveness of non-pharmaceutical interventions, such as social distancing and wearing masks indoors, had been well-established. During this period, we find that Republican-leaning counties experienced up to 3 times higher death rates than Democratic-leaning counties, even after controlling for multiple social vulnerability factors. We also find that Republican-leaning counties in states with less strict mandates experienced the most severe outbreaks. Our findings suggest that ideologies promoted by prominent political actors may not align with efforts to mitigate the impact of the ongoing pandemic and prevent deaths. |
|
Near real-time surveillance of the SARS-CoV-2 epidemic with incomplete data
Pablo M De Salazar, Fred Lu, James A Hay, Diana Gómez-Barroso, Pablo Fernández-Navarro, Elena V Martínez, Jenaro Astray-Mochales, Rocío Amillategui, Ana García-Fulgueiras, Maria D Chirlaque, Alonso Sánchez-Migallón, Amparo Larrauri, María J Sierra, Marc Lipsitch, Fernando Simón, Mauricio Santillana, Miguel A Hernán PLoS computational biology 18 (3), e100996442022 Abstract
When responding to infectious disease outbreaks, rapid and accurate estimation of the epidemic trajectory is critical. However, two common data collection problems affect the reliability of the epidemiological data in real time: missing information on the time of first symptoms, and retrospective revision of historical information, including right censoring. Here, we propose an approach to construct epidemic curves in near real time that addresses these two challenges by 1) imputation of dates of symptom onset for reported cases using a dynamically-estimated “backward” reporting delay conditional distribution, and 2) adjustment for right censoring using the NobBS software package to nowcast cases by date of symptom onset. This process allows us to obtain an approximation of the time-varying reproduction number (Rt) in real time. We apply this approach to characterize the early SARS-CoV-2 outbreak in two Spanish regions between March and April 2020. We evaluate how these real-time estimates compare with more complete epidemiological data that became available later. We explore the impact of the different assumptions on the estimates, and compare our estimates with those obtained from commonly used surveillance approaches. Our framework can help improve accuracy, quantify uncertainty, and evaluate frequently unstated assumptions when recovering the epidemic curves from limited data obtained from public health systems in other locations. |
|
Leveraging Serosurveillance and Postmortem Surveillance to Quantify the Impact of COVID-19 in Africa
Nicole Kogan, Shae Gantt, David Swerdlow, Cecile Viboud, Muhammed Semakula, Marc Lipsitch, Mauricio Santillana medRxiv2022 Abstract
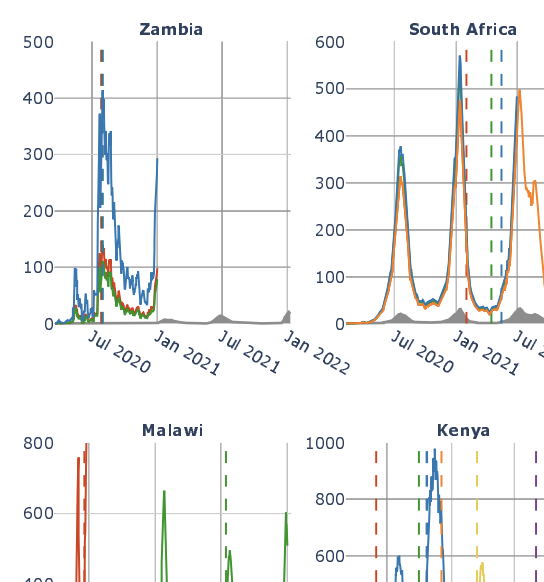
The COVID-19 pandemic has had a devastating impact on global health, the magnitude of which appears to differ intercontinentally: for example, reports suggest 271,900 per million people have been infected in Europe versus 8,800 per million people in Africa. While Africa is the second largest continent by population, its reported COVID-19 cases comprise <3% of global cases. Although social, environmental, and environmental explanations have been proposed to clarify this discrepancy, systematic infection under ascertainment may be equally responsible. |
|
High coverage COVID-19 mRNA vaccination rapidly controls SARS-CoV-2 transmission in Long-Term Care Facilities
de Salazar P, Link N, Lamarca K, Santillana M. Nature Communications Medicine. 2021;1 (16). Abstract
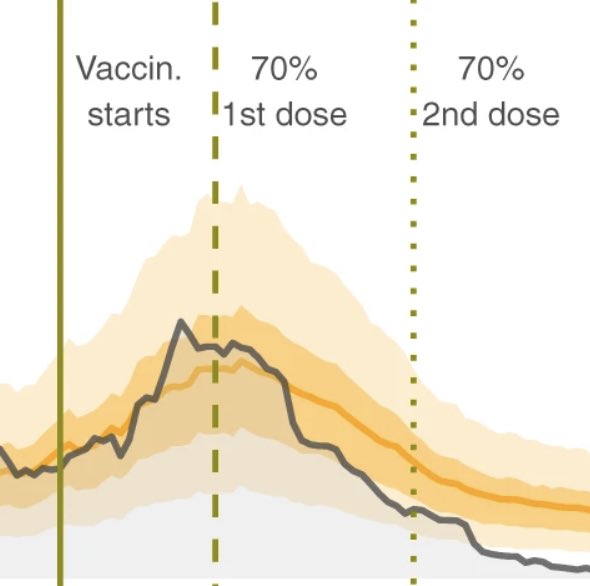
Background Residents of Long-Term Care Facilities (LTCFs) represent a major share of COVID-19 deaths worldwide. Measuring the vaccine effectiveness among the most vulnerable in these settings is essential to monitor and improve mitigation strategies. Methods We evaluate the early effect of the administration of BNT162b2-mRNA vaccine to individuals older than 64 years residing in LTCFs in Catalonia, Spain. We monitor all the SARS-CoV-2 documented infections and deaths among LTCFs residents once more than 70% of them were fully vaccinated (February–March 2021). We develop a modeling framework based on the relationship between community and LTCFs transmission during the pre-vaccination period (July–December 2020). We compute the total reduction in SARS-CoV-2 documented infections and deaths among residents of LTCFs over time, as well as the reduction in the detected transmission for all the LTCFs. We compare the true observations with the counterfactual predictions. Results We estimate that once more than 70% of the LTCFs population are fully vaccinated, 74% (58–81%, 90% CI) of COVID-19 deaths and 75% (36–86%, 90% CI) of all expected documented infections among LTCFs residents are prevented. Further, detectable transmission among LTCFs residents is reduced up to 90% (76–93%, 90% CI) relative to that expected given transmission in the community. Conclusions Our findings provide evidence that high-coverage vaccination is the most effective intervention to prevent SARS-CoV-2 transmission and death among LTCFs residents. Widespread vaccination could be a feasible avenue to control the COVID-19 pandemic conditional on key factors such as vaccine escape, roll out and coverage. |
|
Characterizing features of outbreak duration for novel SARS-CoV-2 variants of concern
AD Washburne, N Hupert, N Kogan, W Hanage, M Santillana medRxiv2022 Abstract
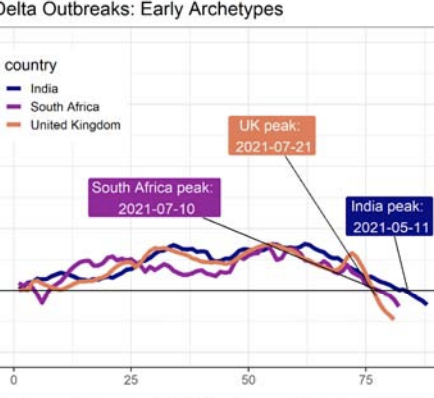
Characterizing the dynamics of epidemic trajectories is critical to understanding the potential impacts of emerging outbreaks and to designing appropriate mitigation strategies. As the COVID-19 pandemic evolves, however, the emergence of SARS-CoV-2 variants of concern has complicated our ability to assess in real-time the potential effects of imminent outbreaks, such as those presently caused by the Omicron variant. Here, we report that SARS-CoV-2 outbreaks across regions exhibit strain-specific times from onset to peak, specifically for Delta and Omicron variants. Our findings may facilitate real-time identification of peak medical demand and may help fine-tune ongoing and future outbreak mitigation deployment efforts. |
|
A nowcasting framework for correcting for reporting delays in malaria surveillance
Tigist F Menkir, Horace Cox, Canelle Poirier, Melanie Saul, Sharon Jones-Weekes, Collette Clementson, Pablo M. de Salazar, Mauricio Santillana, Caroline O Buckee. PLoS Computational Biology 17 (11), e10095702021 Abstract
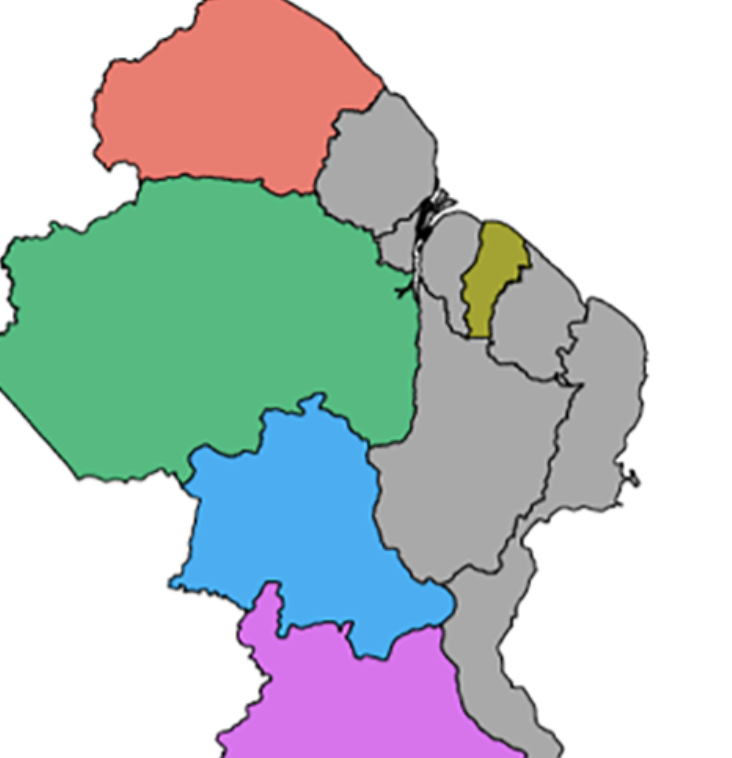
Time lags in reporting to national surveillance systems represent a major barrier for the control of infectious diseases, preventing timely decision making and resource allocation. This issue is particularly acute for infectious diseases like malaria, which often impact rural and remote communities the hardest. In Guyana, a country located in South America, poor connectivity among remote malaria-endemic regions hampers surveillance efforts, making reporting delays a key challenge for elimination. Here, we analyze 13 years of malaria surveillance data, identifying key correlates of time lags between clinical cases occurring and being added to the central data system. We develop nowcasting methods that use historical patterns of reporting delays to estimate occurred-but-not-reported monthly malaria cases. To assess their performance, we implemented them retrospectively, using only information that would have been available at the time of estimation, and found that they substantially enhanced the estimates of malaria cases. Specifically, we found that the best performing models achieved up to two-fold improvements in accuracy (or error reduction) over known cases in selected regions. Our approach provides a simple, generalizable tool to improve malaria surveillance in endemic countries and is currently being implemented to help guide existing resource allocation and elimination efforts. |
|
COVID-19 Positive Cases, Evidence on the Time Evolution of the Epidemic or An Indicator of Local Testing Capabilities? A Case Study in the United States
Kaashoek J, Santillana M. SSRN. 2020. Abstract
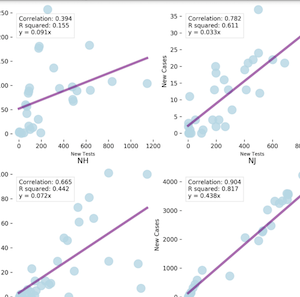
The novel SARS-CoV-2 coronavirus, first identified in Wuhan (Hubei), China, in December 2019, has spread to more than 180 countries and caused over 1,700,000 cases of COVID-19 worldwide to date. In an effort to limit human-to-human contact and slow the transmission of COVID-19, the disease caused by this novel coronavirus, the United States have implemented a collection of shelter-in-place public health interventions. To monitor if these interventions are working and to determine when people may go back to (perhaps a new) business as usual requires reliable monitoring systems that provide an accurate real-time picture of the trajectory of the epidemic outbreak. Here, we present evidence that our current healthcare-based monitoring systems, aimed at detecting the new daily number of COVID-19-positive individuals across the US, may be better at tracking the local testing (detection) capabilities than at monitoring the time evolution of the outbreak. This suggests that other data sources are necessary to inform (real-time) critical decisions about when to stop (and perhaps when to restart) shelter-in-place mitigation strategies. |
|
Communicating Benefits from Vaccines Beyond Preventing Infectious Diseases
Emma-Pascale Chevalier-Cottin, Hayley Ashbaugh, Nicholas Brooke, Gaetan Gavazzi, Mauricio Santillana, Nansa Burlet, Myint Tin Tin Htar. Infectious Diseases and Therapy. 2020;9 :467–480. Abstract
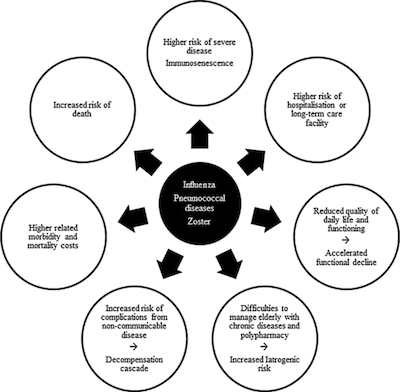
Despite immunisation being one of the greatest medical success stories of the twentieth century, there is a growing lack of confidence in some vaccines. Improving communication about the direct benefits of vaccination as well as its benefits beyond preventing infectious diseases may help regain this lost confidence. A conference was organised at the Fondation Merieux in France to discuss what benefits could be communicated and how innovative digital initiatives can used for communication. During this meeting, a wide range of indirect benefits of vaccination were discussed. For example, influenza vaccination can reduce hospitalisations and deaths in older persons with diabetes by 45% and 38%, respectively, but the link between influenza and complications from underlying chronic non-communicable diseases such as diabetes is frequently underestimated. Vaccination can reduce antimicrobial resistance (AMR), which is growing, by reducing the incidence of infectious disease (though direct and indirect or herd protection), by reducing the number of circulating AMR strains, and by reducing the need for antimicrobial use. Disease morbidity and treatment costs in the elderly population are likely to rise substantially, with the ageing global population. Healthy ageing and life-course vaccination approaches can reduce the burden of vaccine-preventable diseases, such as seasonal influenza and pneumococcal diseases, which place a significant burden on individuals and society, while improving quality of life. Novel disease surveillance systems based on information from Internet search engines, mobile phone apps, social media, cloud-based electronic health records, and crowd-sourced systems, contribute to improved awareness of disease burden. Examples of the role of new techniques and tools to process data generated by multiple sources, such as artificial intelligence, to support vaccination programmes, such as influenza and dengue, were discussed. The conference participants agreed that continual efforts are needed from all stakeholders to ensure effective, transparent communication of the full benefits and risks of vaccination. |
|
Estimation of Pneumonic Plague Transmission in Madagascar, August–November 2017
Majumder MS, Cohn EL, Santillana M, Brownstein JS. PLOS Currents Outbreaks. 2018;1. Abstract
Introduction: Between August and November 2017, Madagascar reported nearly 2500 cases of plague; the vast majority of these cases were pneumonic, resulting in early exponential growth due to person-to-person transmission. Though plague is endemic in Madagascar, cases are usually bubonic and thus result in considerably smaller annual caseloads than those observed from August–November 2017. Methods: In this study, we consider the transmission dynamics of pneumonic plague in Madagascar during this time period, as well as the role of control strategies that were deployed to curb the outbreak and their effectiveness. Results: When using data from the beginning of the outbreak through late November 2017, our estimates for the basic reproduction number range from 1.6 to 3.6, with a mean of 2.4. We also find two distinctive periods of “control”, which coincide with critical on-the-ground interventions, including contact tracing and delivery of antibiotics, among others. Discussion: Given these results, we conclude that existing interventions remain effective against plague in Madagascar, despite the atypical size and spread of this particular outbreak. |
|
Comparison of crowd-sourced, electronic health records based, and traditional health-care based influenza-tracking systems at multiple spatial resolutions in the United States of America
Baltrusaitis K, Brownstein J, Scarpino S, Bakota E, Crawley A, Conidi J, Gunn J, Gray J, Zink A, Santillana M. BMC infectious diseases. 2018;18 (403). Abstract
Background: Influenza causes an estimated 3000 to 50,000 deaths per year in the United States of America (US). Timely and representative data can help local, state, and national public health officials monitor and respond to outbreaks of seasonal influenza. Data from cloud-based electronic health records (EHR) and crowd-sourced influenza surveillance systems have the potential to provide complementary, near real-time estimates of influenza activity. The objectives of this paper are to compare two novel influenza-tracking systems with three traditional healthcare-based influenza surveillance systems at four spatial resolutions: national, regional, state, and city, and to determine the minimum number of participants in these systems required to produce influenza activity estimates that resemble the historical trends recorded by traditional surveillance systems. Methods: We compared influenza activity estimates from five influenza surveillance systems: 1) patient visits for influenza-like illness (ILI) from the US Outpatient ILI Surveillance Network (ILINet), 2) virologic data from World Health Organization (WHO) Collaborating and National Respiratory and Enteric Virus Surveillance System (NREVSS) Laboratories, 3) Emergency Department (ED) syndromic surveillance from Boston, Massachusetts, 4) patient visits for ILI from EHR, and 5) reports of ILI from the crowd-sourced system, Flu Near You (FNY), by calculating correlations between these systems across four influenza seasons, 2012-16, at four different spatial resolutions in the US. For the crowd-sourced system, we also used a bootstrapping statistical approach to estimate the minimum number of reports necessary to produce a meaningful signal at a given spatial resolution. Results: In general, as the spatial resolution increased, correlation values between all influenza surveillance systems decreased. Influenza-like Illness rates in geographic areas with more than 250 crowd-sourced participants or with more than 20,000 visit counts for EHR tracked government-lead estimates of influenza activity. Conclusions: With a sufficient number of reports, data from novel influenza surveillance systems can complement traditional healthcare-based systems at multiple spatial resolutions. |
|
Relatedness of the Incidence Decay with Exponential Adjustment (IDEA) Model," Farr's Law" and SIR Compartmental Difference Equation Models
Santillana M, Tuite A, Nasserie T, Fine P, Champredon D, Chindelevitch L, Dushoff J, Fisman D. Infectious Disease Modelling. 2018;3 :1-12. Abstract
Mathematical models are often regarded as recent innovations in the description and analysis of infectious disease outbreaks and epidemics, but simple mathematical expressions have been in use for projection of epidemic trajectories for more than a century. We recently introduced a single equation model (the incidence decay with exponential adjustment, or IDEA model) that can be used for short-term epidemiological forecasting. In the mid-19th century, Dr. William Farr made the observation that epidemic events rise and fall in a roughly symmetrical pattern that can be approximated by a bell-shaped curve. He noticed that this time-evolution behavior could be captured by a single mathematical formula (“Farr's law”) that could be used for epidemic forecasting. We show here that the IDEA model follows Farr's law, and show that for intuitive assumptions, Farr's Law can be derived from the IDEA model. Moreover, we show that both mathematical approaches, Farr's Law and the IDEA model, resemble solutions of a susceptible-infectious-removed (SIR) compartmental differential-equation model in an asymptotic limit, where the changes of disease transmission respond to control measures, and not only to the depletion of susceptible individuals. This suggests that the concept of the reproduction number (R0) was implicitly captured in Farr's (pre-microbial era) work, and also suggests that control of epidemics, whether via behavior change or intervention, is as integral to the natural history of epidemics as is the dynamics of disease transmission. |
|
County-level assessment of United States kindergarten vaccination rates for measles mumps rubella (MMR) for the 2014--2015 school year
Kluberg SA, McGinnis DP, Hswen Y, Majumder MS, Santillana M, Brownstein JS. Vaccine. 2017;35 :6444-6450. Abstract
United States kindergarten measles-mumps-rubella (MMR) vaccination rates are typically reported at the state level by the Centers for Disease Control and Prevention (CDC). The lack of local MMR data prevents identification of areas with low vaccination rates that would be vulnerable to the spread of disease. We collected county-level vaccination rates for the 2014-2015 school year with the objective of identifying these regions. We requested county-level kindergarten vaccination data from state health departments, and mapped these data to visualize geographic patterns in achievement of the 95% MMR vaccination target. We aggregated the county-level data to the state level for comparison against CDC state estimates. We also analyzed the relationship of MMR vaccination level with county-level and state-level poverty (using U.S. census data), using both a national mixed model with state as a random effect, and individual linear regression models by state. We received county vaccination data from 43 states. The median kindergarten MMR vaccination rate was 96.0% (IQR 89-98) across all counties, however, we estimated that 48.4% of the represented counties had vaccination rates below 95%. Our state estimates closely reflected CDC values. Nationally, every 10% increase in under-18 county poverty was associated with a 0.24% increase in MMR vaccination rates (95% CI: -0.07%; 0.54%), but the direction of this relationship varied by state. We found that county data can reveal vaccination trends that are unobservable from state-level data, but we also discovered that the current availability of county-level data is inadequate. Our findings can be used by state health departments to identify target areas for vaccination programs. |
|
Utilizing Nontraditional Data Sources for Near Real-Time Estimation of Transmission Dynamics During the 2015-2016 Colombian Zika Virus Disease Outbreak
Majumder MS, Santillana M, Mekaru SR, McGinnis DP, Khan K, Brownstein JS. JMIR public health and surveillance. 2016;2 (1) :e30. Abstract
Background: Approximately 40 countries in Central and South America have experienced local vector-born transmission of Zika virus, resulting in nearly 300,000 total reported cases of Zika virus disease to date. Of the cases that have sought care thus far in the region, more than 70,000 have been reported out of Colombia. Objective: In this paper, we use nontraditional digital disease surveillance data via HealthMap and Google Trends to develop near real-time estimates for the basic (R) and observed (Robs) reproductive numbers associated with Zika virus disease in Colombia. We then validate our results against traditional health care-based disease surveillance data. Methods: Cumulative reported case counts of Zika virus disease in Colombia were acquired via the HealthMap digital disease surveillance system. Linear smoothing was conducted to adjust the shape of the HealthMap cumulative case curve using Google search data. Traditional surveillance data on Zika virus disease were obtained from weekly Instituto Nacional de Salud (INS) epidemiological bulletin publications. The Incidence Decay and Exponential Adjustment (IDEA) model was used to estimate R0 and Robs for both data sources. Results: Using the digital (smoothed HealthMap) data, we estimated a mean R0 of 2.56 (range 1.42-3.83) and a mean Robs of 1.80 (range 1.42-2.30). The traditional (INS) data yielded a mean R0 of 4.82 (range 2.34-8.32) and a mean Robs of 2.34 (range 1.60-3.31). |

