Research |
Digital Epidemiology: design and implementation of Machine Learning-based decision-support tools to help public health officials anticipate and monitor changes in the time evolution of epidemic outbreaks.
|
In today’s era of “big data,” a tremendous amount of information is collected as we interact with technology in every aspect of our lives. Machine learning methods that detect and extract patterns from these data can reveal details about human behavior that are not readily apparent to the naked eye
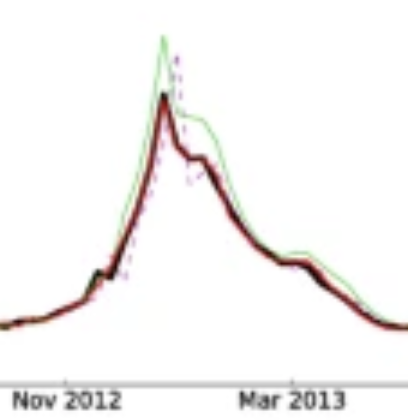
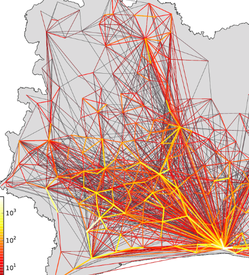
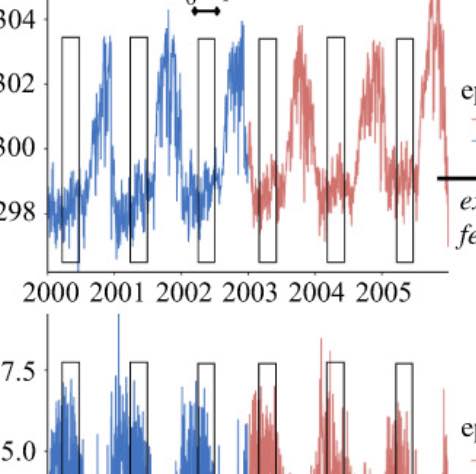
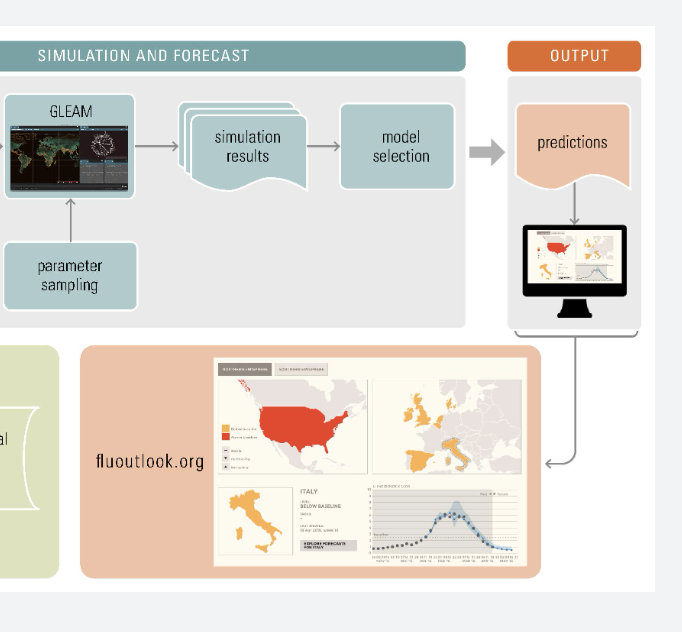
Our team works towards the design and implementation of digital epidemiology tools aimed at monitoring disease outbreaks in real-time. We are constantly developing methodologies that leverage information from multiple data-sources including Google search query patterns, Twitter microblogs, cloud-based electronic health records, clinicians' searches, local weather, and human mobility, to produce real-time and short-term forecast disease activity estimates of pandemic events such as the ongoing COVID-19 and monkeypox pandemics (the 2014 West African Ebola outbreak, the 2014 Latin American Zika outbreak), and endemic disease outbreaks such as dengue fever, influenza and malaria. |
We are constantly striving to improve our real-time disease estimates with the goal of assisting public health officials make informed decisions to mitigate the effects of disease outbreaks. Our platform will soon display disease estimates for Dengue, Flu, and a diverse arrray of emerging outbreaks throughout the world.
|
Related publications
|
Mathematical assessment of the role of human behavior changes on SARS-CoV-2 transmission dynamics
Binod Pant, Salman Safdar, Mauricio Santillana, and Abba B. Gumel. medRxiv. doi: https://doi.org/10.1101/2024.02.11.24302662 Abstract
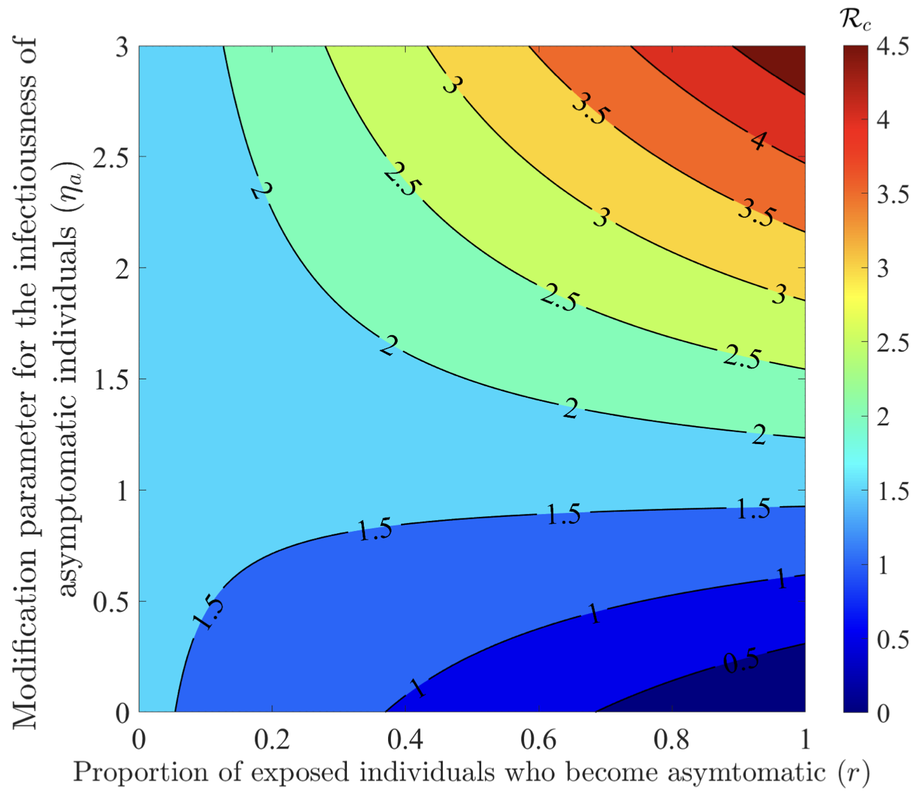
The COVID-19 pandemic has not only presented a major global public health and socio-economic crisis, but has also significantly impacted human behavior towards adherence (or lack thereof) to public health intervention and mitigation measures implemented in communities worldwide. The dynamic nature of the pandemic has prompted extensive changes in individual and collective behaviors towards the pandemic. This study is based on the use of mathematical modeling approaches to assess the extent to which SARS-CoV-2 transmission dynamics is impacted by population-level changes of human behavior due to factors such as (a) the severity of transmission (such as disease-induced mortality and level of symptomatic transmission), (b) fatigue due to the implementation of mitigation interventions measures (e.g., lockdowns) over a long (extended) period of time, (c) social peer-pressure, among others. A novel behavior-epidemiology model, which takes the form of a deterministic system of nonlinear differential equations, is developed and fitted using observed cumulative SARS-CoV-2 mortality data during the first wave in the United States. Rigorous analysis of the model shows that its disease-free equilibrium is locally-asymptotically stable whenever a certain epidemiological threshold, known as the control reproduction number (denoted by RC ) is less than one, and the disease persists (i.e., causes significant outbreak or outbreaks) if the threshold exceeds one. The model fits the observed data, as well as makes a more accurate prediction of the observed daily SARS-CoV-2 mortality during the first wave (March 2020 -June 2020), in comparison to the equivalent model which does not explicitly account for changes in human behavior. Of the various metrics for human behavior changes during the pandemic considered in this study, it is shown that behavior changes due to the level of SARS-CoV-2 mortality and symptomatic transmission were more influential (while behavioral changes due to the level of fatigue to interventions in the community was of marginal impact). It is shown that an increase in the proportion of exposed individuals who become asymptomatically-infectious at the end of the exposed period (represented by a parameter r) can lead to an increase (decrease) in the control reproduction number (RC) if the effective contact rate of asymptomatic individuals is higher (lower) than that of symptomatic individuals. The study identifies two threshold values of the parameter r that maximize the cumulative and daily SARS-CoV-2 mortality, respectively, during the first wave. Furthermore, it is shown that, as the value of the proportion r increases from 0 to 1, the rate at which susceptible non-adherent individuals change their behavior to strictly adhere to public health interventions decreases. Hence, this study suggests that, as more newly- infected individuals become asymptomatically-infectious, the level of positive behavior change, as well as disease severity, hospitalizations and disease-induced mortality in the community can be expected to significantly decrease (while new cases may rise, particularly if asymptomatic individuals have higher contact rate, in comparison to symptomatic individuals). |
|
Pediatric and Young Adult Household Transmission of the Initial Waves of SARS-CoV-2 in the United States: Administrative Claims Study
Ming Kei Chung, Brian Hart, Mauricio Santillana, Chirag J Patel. Journal of Medical Internet Research 2024; 26:e44249 Abstract
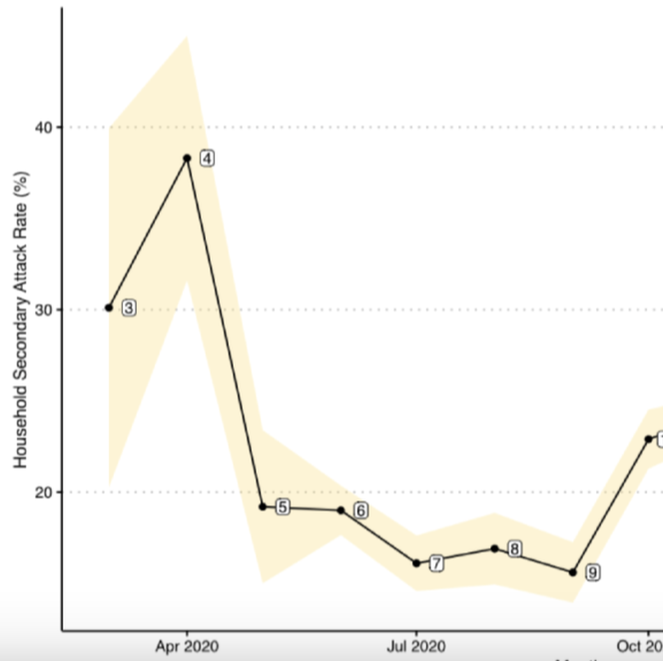
Background: The correlates responsible for the temporal changes of intrahousehold SARS-CoV-2 transmission in the United States have been understudied mainly due to a lack of available surveillance data. Specifically, early analyses of SARS-CoV-2 household secondary attack rates (SARs) were small in sample size and conducted cross-sectionally at single time points. From these limited data, it has been difficult to assess the role that different risk factors have had on intrahousehold disease transmission in different stages of the ongoing COVID-19 pandemic, particularly in children and youth. Objective: This study aimed to estimate the transmission dynamic and infectivity of SARS-CoV-2 among pediatric and young adult index cases (age 0 to 25 years) in the United States through the initial waves of the pandemic. Methods: Using administrative claims, we analyzed 19 million SARS-CoV-2 test records between January 2020 and February 2021. We identified 36,241 households with pediatric index cases and calculated household SARs utilizing complete case information. Using a retrospective cohort design, we estimated the household SARS-CoV-2 transmission between 4 index age groups (0 to 4 years, 5 to 11 years, 12 to 17 years, and 18 to 25 years) while adjusting for sex, family size, quarter of first SARS-CoV-2 positive record, and residential regions of the index cases. Results: After filtering all household records for greater than one member in a household and missing information, only 36,241 (0.85%) of 4,270,130 households with a pediatric case remained in the analysis. Index cases aged between 0 and 17 years were a minority of the total index cases (n=11,484, 11%). The overall SAR of SARS-CoV-2 was 23.04% (95% CI 21.88-24.19). As a comparison, the SAR for all ages (0 to 65+ years) was 32.4% (95% CI 32.1-32.8), higher than the SAR for the population between 0 and 25 years of age. The highest SAR of 38.3% was observed in April 2020 (95% CI 31.6-45), while the lowest SAR of 15.6% was observed in September 2020 (95% CI 13.9-17.3). It consistently decreased from 32% to 21.1% as the age of index groups increased. In a multiple logistic regression analysis, we found that the youngest pediatric age group (0 to 4 years) had 1.69 times (95% CI 1.42-2.00) the odds of SARS-CoV-2 transmission to any family members when compared with the oldest group (18 to 25 years). Family size was significantly associated with household viral transmission (odds ratio 2.66, 95% CI 2.58-2.74). Conclusions: Using retrospective claims data, the pediatric index transmission of SARS-CoV-2 during the initial waves of the COVID-19 pandemic in the United States was associated with location and family characteristics. Pediatric SAR (0 to 25 years) was less than the SAR for all age other groups. Less than 1% (n=36,241) of all household data were retained in the retrospective study for complete case analysis, perhaps biasing our findings. We have provided measures of baseline household pediatric transmission for tracking and comparing the infectivity of later SARS-CoV-2 variants. |
|
Fine-Grained Forecasting of COVID-19 Trends at the County Level in the United States
Tzu-Hsi Songa, Leonardo Clemente, Xiang Pana, Junbong Janga, Mauricio Santillanab, and Kwonmoo Leea. medRxiv. doi: https://doi.org/10.1101/2024.01.13.24301248 Abstract
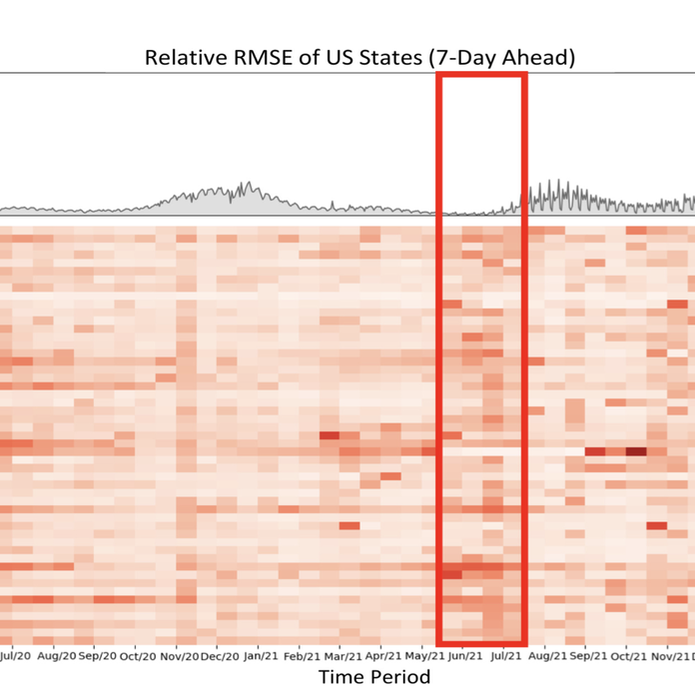
The coronavirus (COVID-19) pandemic has profoundly impacted various aspects of daily life, society, healthcare systems, and global health policies. This pandemic has resulted in more than one hundred million people being infected and, unfortunately, the loss of life for many individuals. Although treatment for the coronavirus is now available, effective forecasting of COVID-19 infec- tion is the most importance to aid public health officials in making critical decisions. However, forecasting COVID-19 trends through time-series analysis poses significant challenges due to the data’s inherently dynamic, transient, and noise-prone nature. In this study, we have developed the Fine-Grained Infection Forecast Network (FIGI-Net) model, which provides accurate forecasts of COVID-19 trends up to two weeks in advance. FIGI-Net addresses the current limitations in COVID-19 forecasting by leveraging fine-grained county-level data and a stacked bidirectional LSTM structure. We employ a pre-trained model to capture essential global infection patterns. Subsequently, these pre-trained parameters were transferred to train localized sub-models for county clusters exhibiting comparable infection dynamics. This model adeptly handles sudden changes and rapid fluctuations in data, frequently observed across various times and locations of county-level data, ultimately improving the accuracy of COVID-19 infection forecasting at the county, state, and national levels. FIGI-Net model demonstrated significant improvement over other deep learning-based models and state-of-the-art COVID-19 forecasting models, evident in various standard evaluation metrics. Notably, FIGI-Net model excels at forecasting the direction of infection trends, especially during the initial phases of different COVID-19 outbreak waves. Our study underscores the effectiveness and superiority of our time-series deep learning-based methods in addressing dynamic and sudden changes in infection numbers over short-term time periods. These capabilities facilitate efficient public health management and the early implementation of COVID-19 transmission prevention measures. |
|
An Early Warning Approach to Monitor COVID-19 Activity with Multiple Digital Traces in Near Real-Time
Kogan NE, Clemente L, Liautaud P, Kaashoek J, Link NB, Nguyen AT, Lu FS, Huybers P, Resch B, Havas C, et al. Science Advances. 2021;7 (10). Abstract
Given still-high levels of coronavirus disease 2019 (COVID-19) susceptibility and inconsistent transmission-containing strategies, outbreaks have continued to emerge across the United States. Until effective vaccines are widely deployed, curbing COVID-19 will require carefully timed nonpharmaceutical interventions (NPIs). A COVID-19 early warning system is vital for this. Here, we evaluate digital data streams as early indicators of state-level COVID-19 activity from 1 March to 30 September 2020. We observe that increases in digital data stream activity anticipate increases in confirmed cases and deaths by 2 to 3 weeks. Confirmed cases and deaths also decrease 2 to 4 weeks after NPI implementation, as measured by anonymized, phone-derived human mobility data. We propose a means of harmonizing these data streams to identify future COVID-19 outbreaks. Our results suggest that combining disparate health and behavioral data may help identify disease activity changes weeks before observation using traditional epidemiological monitoring. |
|
Using digital traces to build prospective and real-time county-level early warning systems to anticipate COVID-19 outbreaks in the United States
Lucas M Stolerman, Leonardo Clemente, Canelle Poirier, Kris V Parag, Atreyee Majumder, Serge Masyn, Bernd Resch, Mauricio Santillana Science Advances. 2023; Vol 9: Issue 3. Abstract
Coronavirus disease 2019 (COVID-19) continues to affect the world, and the design of strategies to curb disease outbreaks requires close monitoring of their trajectories. We present machine learning methods that leverage internet-based digital traces to anticipate sharp increases in COVID-19 activity in U.S. counties. In a complemen- tary direction to the efforts led by the Centers for Disease Control and Prevention (CDC), our models are de- signed to detect the time when an uptrend in COVID-19 activity will occur. Motivated by the need for finer spatial resolution epidemiological insights, we build upon previous efforts conceived at the state level. Our methods—tested in an out-of-sample manner, as events were unfolding, in 97 counties representative of mul- tiple population sizes across the United States—frequently anticipated increases in COVID-19 activity 1 to 6 weeks before local outbreaks, defined when the effective reproduction number Rt becomes larger than 1 for a period of 2 weeks. |
|
Using general messages to persuade on a politicized scientific issue
Jon Green, James N Druckman, Matthew A Baum, David Lazer, Katherine Ognyanova, Matthew D Simonson, Jennifer Lin, Mauricio Santillana, Roy H Perlis British Journal of Political Science. 2023; 53(2)698-706. Abstract
Politics and science have become increasingly intertwined. Salient scientific issues, such as climate change, evolution, and stem-cell research, become politicized, pitting partisans against one another. This creates a challenge of how to effectively communicate on such issues. Recent work emphasizes the need for tailored messages to specific groups. Here, we focus on whether generalized messages also can matter. We do so in the context of a highly polarized issue: extreme COVID-19 vaccine resistance. The results show that science-based, moral frame, and social norm messages move behavioral intentions, and do so by the same amount across the population (that is, homogeneous effects). Counter to common portrayals, the politicization of science does not preclude using broad messages that resonate with the entire population. |
|
Gastroenteritis Forecasting Assessing the Use of Web and Electronic Health Record Data With a Linear and a Nonlinear Approach: Comparison Study
Canelle Poirier, Guillaume Bouzillé, Valérie Bertaud, Marc Cuggia, Mauricio Santillana, Audrey Lavenu JMIR Public Health and Surveillance. 2023; 9;e34982 Abstract
Background: Disease surveillance systems capable of producing accurate real-time and short-term forecasts can help public health officials design timely public health interventions to mitigate the effects of disease outbreaks in affected populations. In France, existing clinic-based disease surveillance systems produce gastroenteritis activity information that lags real time by 1 to 3 weeks. This temporal data gap prevents public health officials from having a timely epidemiological characterization of this disease at any point in time and thus leads to the design of interventions that do not take into consideration the most recent changes in dynamics. Objective: The goal of this study was to evaluate the feasibility of using internet search query trends and electronic health records to predict acute gastroenteritis (AG) incidence rates in near real time, at the national and regional scales, and for long-term forecasts (up to 10 weeks). Methods: We present 2 different approaches (linear and nonlinear) that produce real-time estimates, short-term forecasts, and long-term forecasts of AG activity at 2 different spatial scales in France (national and regional). Both approaches leverage disparate data sources that include disease-related internet search activity, electronic health record data, and historical disease activity. Results: Our results suggest that all data sources contribute to improving gastroenteritis surveillance for long-term forecasts with the prominent predictive power of historical data owing to the strong seasonal dynamics of this disease. Conclusions: The methods we developed could help reduce the impact of the AG peak by making it possible to anticipate increased activity by up to 10 weeks. |
|
Improved state-level influenza activity nowcasting in the United States leveraging Internet-based data sources and network approaches
Lu F, Hattab M, Clemente L, Santillana M. Nature Communications. 2019;10 (147). Abstract
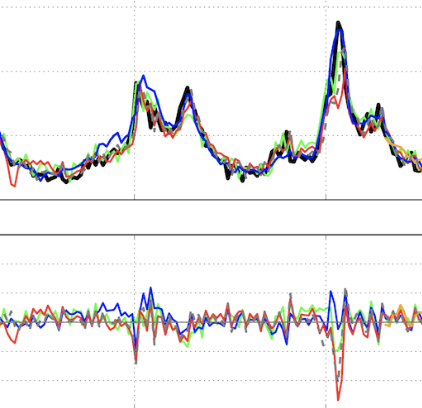
In the presence of health threats, precision public health approaches aim to provide targeted, timely, and population-specific interventions. Accurate surveillance methodologies that can estimate infectious disease activity ahead of official healthcare-based reports, at relevant spatial resolutions, are important for achieving this goal. Here we introduce a methodological framework which dynamically combines two distinct influenza tracking techniques, using an ensemble machine learning approach, to achieve improved state-level influenza activity estimates in the United States. The two predictive techniques behind the ensemble utilize (1) a self-correcting statistical method combining influenza-related Google search frequencies, information from electronic health records, and historical flu trends within each state, and (2) a network-based approach leveraging spatio-temporal synchronicities observed in historical influenza activity across states. The ensemble considerably outperforms each component method in addition to previously proposed state-specific methods for influenza tracking, with higher correlations and lower prediction errors. |
|
Towards the Use of Neural Networks for Influenza Prediction at Multiple Spatial Resolutions
Aiken EL, Nguyen AT, Viboud C, Santillana M. Science Advances. 2021;7 (25). Abstract
Mitigating the effects of disease outbreaks with timely and effective interventions requires accurate real-time surveillance and forecasting of disease activity, but traditional health care–based surveillance systems are limited by inherent reporting delays. Machine learning methods have the potential to fill this temporal “data gap,” but work to date in this area has focused on relatively simple methods and coarse geographic resolutions (state level and above). We evaluate the predictive performance of a gated recurrent unit neural network approach in comparison with baseline machine learning methods for estimating influenza activity in the United States at the state and city levels and experiment with the inclusion of real-time Internet search data. We find that the neural network approach improves upon baseline models for long time horizons of prediction but is not improved by real-time internet search data. We conduct a thorough analysis of feature importances in all considered models for interpretability purposes. |
|
Effect of non-pharmaceutical interventions for containing the COVID-19 outbreak in China.
Lai S, Ruktanonchai NW, Zhou L, Prosper O, Luo W, Floyd JR, Wesolowski A, Santillana M, Zhang C, Du X, et al. Nature . 2020;https://doi.org/10.1038/s41586-020-2293-x. Abstract
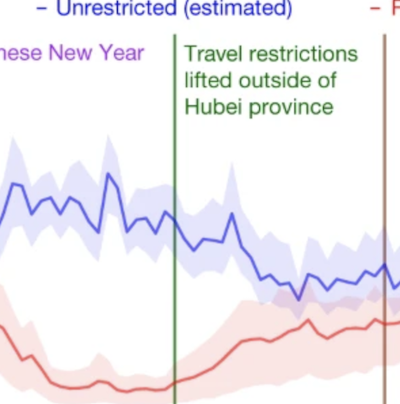
On 11 March 2020, the World Health Organization (WHO) declared coronavirus disease 2019 (COVID-19) a pandemic1. The strategies based on non-pharmaceutical interventions that were used to contain the outbreak in China appear to be effective2, but quantitative research is still needed to assess the efficacy of non-pharmaceutical interventions and their timings3. Here, using epidemiological data on COVID-19 and anonymized data on human movement4,5, we develop a modelling framework that uses daily travel networks to simulate different outbreak and intervention scenarios across China. We estimate that there were a total of 114,325 cases of COVID-19 (interquartile range 76,776–164,576) in mainland China as of 29 February 2020. Without non-pharmaceutical interventions, we predict that the number of cases would have been 67-fold higher (interquartile range 44–94-fold) by 29 February 2020, and we find that the effectiveness of different interventions varied. We estimate that early detection and isolation of cases prevented more infections than did travel restrictions and contact reductions, but that a combination of non-pharmaceutical interventions achieved the strongest and most rapid effect. According to our model, the lifting of travel restrictions from 17 February 2020 does not lead to an increase in cases across China if social distancing interventions can be maintained, even at a limited level of an on average 25% reduction in contact between individuals that continues until late April. These findings improve our understanding of the effects of non-pharmaceutical interventions on COVID-19, and will inform response efforts across the world. |
|
Combining search, social media, and traditional data sources to improve influenza surveillance
Santillana M, Nguyen AT, Dredze M, Paul MJ, Nsoesie EO, Brownstein JS. PLoS Comput Biol. 2015;11 (10) :e1004513. Abstract
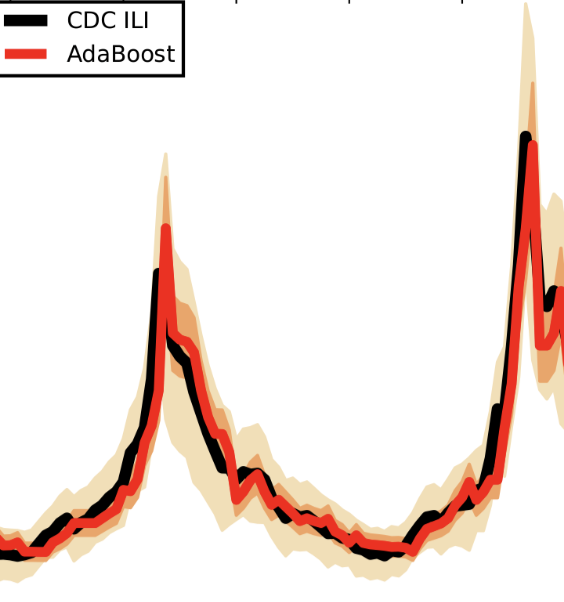
We present a machine learning-based methodology capable of providing real-time (“nowcast”) and forecast estimates of influenza activity in the US by leveraging data from multiple data sources including: Google searches, Twitter microblogs, nearly real-time hospital visit records, and data from a participatory surveillance system. Our main contribution consists of combining multiple influenza-like illnesses (ILI) activity estimates, generated independently with each data source, into a single prediction of ILI utilizing machine learning ensemble approaches. Our methodology exploits the information in each data source and produces accurate weekly ILI predictions for up to four weeks ahead of the release of CDC’s ILI reports. We evaluate the predictive ability of our ensemble approach during the 2013–2014 (retrospective) and 2014–2015 (live) flu seasons for each of the four weekly time horizons. Our ensemble approach demonstrates several advantages: (1) our ensemble method’s predictions outperform every prediction using each data source independently, (2) our methodology can produce predictions one week ahead of GFT’s real-time estimates with comparable accuracy, and (3) our two and three week forecast estimates have comparable accuracy to real-time predictions using an autoregressive model. Moreover, our results show that considerable insight is gained from incorporating disparate data streams, in the form of social media and crowd sourced data, into influenza predictions in all time horizons. |
|
Accurate estimation of influenza epidemics using Google search data via ARGO
Yang S, Santillana M, Kou SC. Proceedings of the National Academy of Sciences. 2015;112 (47) :14473–14478. Abstract
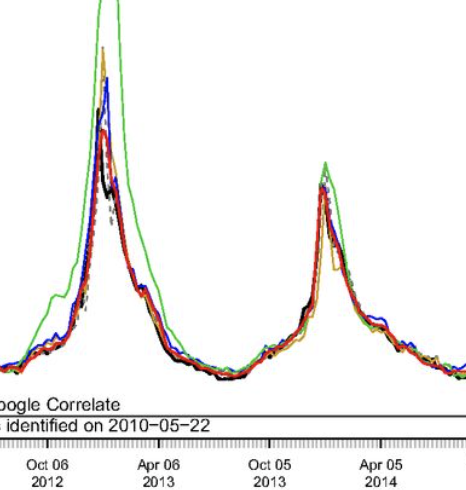
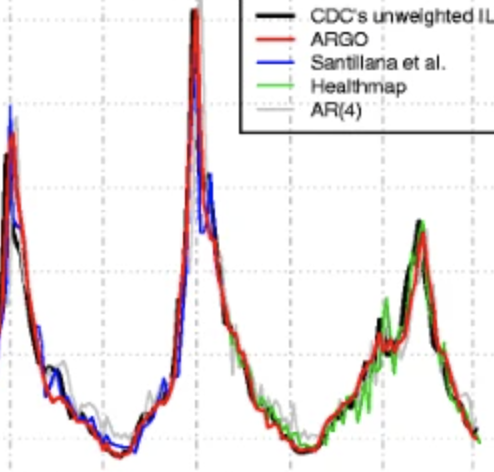
Accurate real-time tracking of influenza outbreaks helps public health officials make timely and meaningful decisions that could save lives. We propose an influenza tracking model, ARGO (AutoRegression with GOogle search data), that uses publicly available online search data. In addition to having a rigorous statistical foundation, ARGO outperforms all previously available Google-search–based tracking models, including the latest version of Google Flu Trends, even though it uses only low-quality search data as input from publicly available Google Trends and Google Correlate websites. ARGO not only incorporates the seasonality in influenza epidemics but also captures changes in people’s online search behavior over time. ARGO is also flexible, self-correcting, robust, and scalable, making it a potentially powerful tool that can be used for real-time tracking of other social events at multiple temporal and spatial resolutions. |
|
What can digital disease detection learn from (an external revision to) Google Flu Trends?
Santillana M, Zhang WD, Althouse BM, Ayers JW. American journal of preventive medicine. 2014;47 (3) :341–347. Abstract
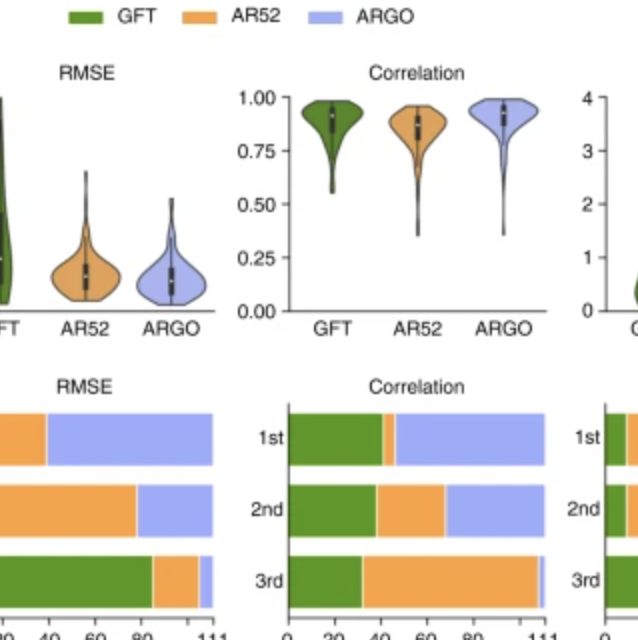
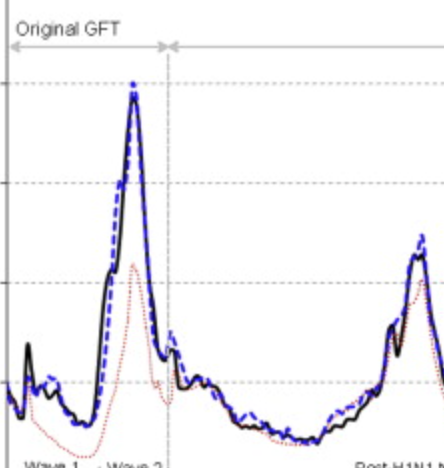
Background: Google Flu Trends (GFT) claimed to generate real-time, valid predictions of population influenza-like illness (ILI) using search queries, heralding acclaim and replication across public health. However, recent studies have questioned the validity of GFT. Purpose: To propose an alternative methodology that better realizes the potential of GFT, with collateral value for digital disease detection broadly. Methods: Our alternative method automatically selects specific queries to monitor and autonomously updates the model each week as new information about CDC-reported ILI becomes available, as developed in 2013. Root mean squared errors (RMSEs) and Pearson correlations comparing predicted ILI (proportion of patient visits indicative of ILI) with subsequently observed ILI were used to judge model performance. Results: During the height of the H1N1 pandemic (August 2 to December 22, 2009) and the 2012-2013 season (September 30, 2012, to April 12, 2013), GFT's predictions had RMSEs of 0.023 and 0.022 (i.e., hypothetically, if GFT predicted 0.061 ILI one week, it is expected to err by 0.023) and correlations of r=0.916 and 0.927. Our alternative method had RMSEs of 0.006 and 0.009, and correlations of r=0.961 and 0.919 for the same periods. Critically, during these important periods, the alternative method yielded more accurate ILI predictions every week, and was typically more accurate during other influenza seasons. Conclusions: GFT may be inaccurate, but improved methodologic underpinnings can yield accurate predictions. Applying similar methods elsewhere can improve digital disease detection, with broader transparency, improved accuracy, and real-world public health impacts. |
|
Accurate influenza monitoring and forecasting in the Boston metropolis using novel Internet data streams
Lu F, Hou S, Baltrusaitis K, Shah M, Leskovec J, Sosic R, Hawkins J, Brownstein JS, Conidi G, Gunn J, et al. Journal of Medical Internet Research. 2018;4 (1) :e4. Abstract
Background:Influenza outbreaks pose major challenges to public health around the world, leading to thousands of deaths a year in the United States alone. Accurate systems that track influenza activity at the city level are necessary to provide actionable information that can be used for clinical, hospital, and community outbreak preparation. Objective:Although Internet-based real-time data sources such as Google searches and tweets have been successfully used to produce influenza activity estimates ahead of traditional health care–based systems at national and state levels, influenza tracking and forecasting at finer spatial resolutions, such as the city level, remain an open question. Our study aimed to present a precise, near real-time methodology capable of producing influenza estimates ahead of those collected and published by the Boston Public Health Commission (BPHC) for the Boston metropolitan area. This approach has great potential to be extended to other cities with access to similar data sources. Methods:We first tested the ability of Google searches, Twitter posts, electronic health records, and a crowd-sourced influenza reporting system to detect influenza activity in the Boston metropolis separately. We then adapted a multivariate dynamic regression method named ARGO (autoregression with general online information), designed for tracking influenza at the national level, and showed that it effectively uses the above data sources to monitor and forecast influenza at the city level 1 week ahead of the current date. Finally, we presented an ensemble-based approach capable of combining information from models based on multiple data sources to more robustly nowcast as well as forecast influenza activity in the Boston metropolitan area. The performances of our models were evaluated in an out-of-sample fashion over 4 influenza seasons within 2012-2016, as well as a holdout validation period from 2016 to 2017. Results:Our ensemble-based methods incorporating information from diverse models based on multiple data sources, including ARGO, produced the most robust and accurate results. The observed Pearson correlations between our out-of-sample flu activity estimates and those historically reported by the BPHC were 0.98 in nowcasting influenza and 0.94 in forecasting influenza 1 week ahead of the current date. Conclusions:We show that information from Internet-based data sources, when combined using an informed, robust methodology, can be effectively used as early indicators of influenza activity at fine geographic resolutions. |
|
SARS-CoV-2 RNA concentrations in wastewater foreshadow dynamics and clinical presentation of new COVID-19 cases
Fuqing Wu, Amy Xiao, Jianbo Zhang, Katya Moniz, Noriko Endo, Federica Armas, Richard Bonneau, Megan A Brown, Mary Bushman, Peter R Chai, Claire Duvallet, Timothy B Erickson, Katelyn Foppe, Newsha Ghaeli, Xiaoqiong Gu, William P Hanage, Katherine H Huang, Wei Lin Lee, Mariana Matus, Kyle A McElroy, Jonathan Nagler, Steven F Rhode, Mauricio Santillana, Joshua A Tucker, Stefan Wuertz, Shijie Zhao, Janelle Thompson, Eric J Alm Science of The Total Environment 805, 1501211452022 Abstract
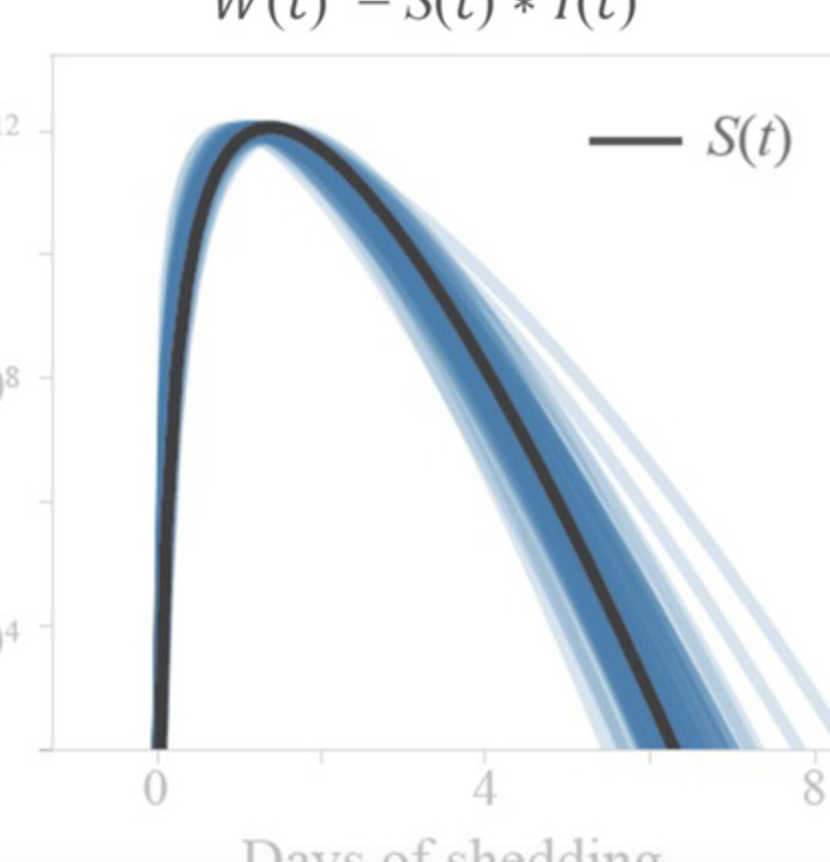
Current estimates of COVID-19 prevalence are largely based on symptomatic, clinically diagnosed cases. The existence of a large number of undiagnosed infections hampers population-wide investigation of viral circulation. Here, we quantify the SARS-CoV-2 concentration and track its dynamics in wastewater at a major urban wastewater treatment facility in Massachusetts, between early January and May 2020. SARS-CoV-2 was first detected in wastewater on March 3. SARS-CoV-2 RNA concentrations in wastewater correlated with clinically diagnosed new COVID-19 cases, with the trends appearing 4–10 days earlier in wastewater than in clinical data. We inferred viral shedding dynamics by modeling wastewater viral load as a convolution of back-dated new clinical cases with the average population-level viral shedding function. The inferred viral shedding function showed an early peak, likely before symptom onset and clinical diagnosis, consistent with emerging clinical and experimental evidence. This finding suggests that SARS-CoV-2 concentrations in wastewater may be primarily driven by viral shedding early in infection. This work shows that longitudinal wastewater analysis can be used to identify trends in disease transmission in advance of clinical case reporting, and infer early viral shedding dynamics for newly infected individuals, which are difficult to capture in clinical investigations. |
|
Advances in the use of Google searches to track dengue in Mexico, Brazil, Thailand, Singapore and Taiwan
Yang S, Kou SC, Lu F, Brownstein JS, Brooke N, Santillana M. PLoS Computational Biology. 2017;13 (7) :e1005607. Abstract
Dengue is a mosquito-borne disease that threatens more than half of the world's population. Despite being endemic to over 100 countries, government-led efforts and mechanisms to timely identify and track the emergence of new infections are still lacking in many affected areas. Multiple methodologies that leverage the use of Internet-based data sources have been proposed as a way to complement dengue surveillance efforts. Among these, the trends in dengue-related Google searches have been shown to correlate with dengue activity. We extend a methodological framework, initially proposed and validated for flu surveillance, to produce near real-time estimates of dengue cases in five countries/regions: Mexico, Brazil, Thailand, Singapore and Taiwan. Our result shows that our modeling framework can be used to improve the tracking of dengue activity in multiple locations around the world. |
|
Forecasting Zika Incidence in the 2016 Latin America Outbreak Combining Traditional Disease Surveillance with Search, Social Media, and News Report Data.
McGough SF, Brownstein JS, Hawkins J, Santillana M. PLoS Neglected Tropical Diseases. 2017;11 (1) :e0005295. Abstract
BackgroundOver 400,000 people across the Americas are thought to have been infected with Zika virus as a consequence of the 2015–2016 Latin American outbreak. Official government-led case count data in Latin America are typically delayed by several weeks, making it difficult to track the disease in a timely manner. Thus, timely disease tracking systems are needed to design and assess interventions to mitigate disease transmission. Methodology/Principal FindingsWe combined information from Zika-related Google searches, Twitter microblogs, and the HealthMap digital surveillance system with historical Zika suspected case counts to track and predict estimates of suspected weekly Zika cases during the 2015–2016 Latin American outbreak, up to three weeks ahead of the publication of official case data. We evaluated the predictive power of these data and used a dynamic multivariable approach to retrospectively produce predictions of weekly suspected cases for five countries: Colombia, El Salvador, Honduras, Venezuela, and Martinique. Models that combined Google (and Twitter data where available) with autoregressive information showed the best out-of-sample predictive accuracy for 1-week ahead predictions, whereas models that used only Google and Twitter typically performed best for 2- and 3-week ahead predictions. SignificanceGiven the significant delay in the release of official government-reported Zika case counts, we show that these Internet-based data streams can be used as timely and complementary ways to assess the dynamics of the outbreak. |
|
Real-time Estimation of Disease Activity in Emerging Outbreaks using Internet Search Information
Aiken E, McGough S, Majumder M, Wachtel G, Nguyen AT, Viboud C, Santillana M. PLoS Computational Biology. 2020. Abstract
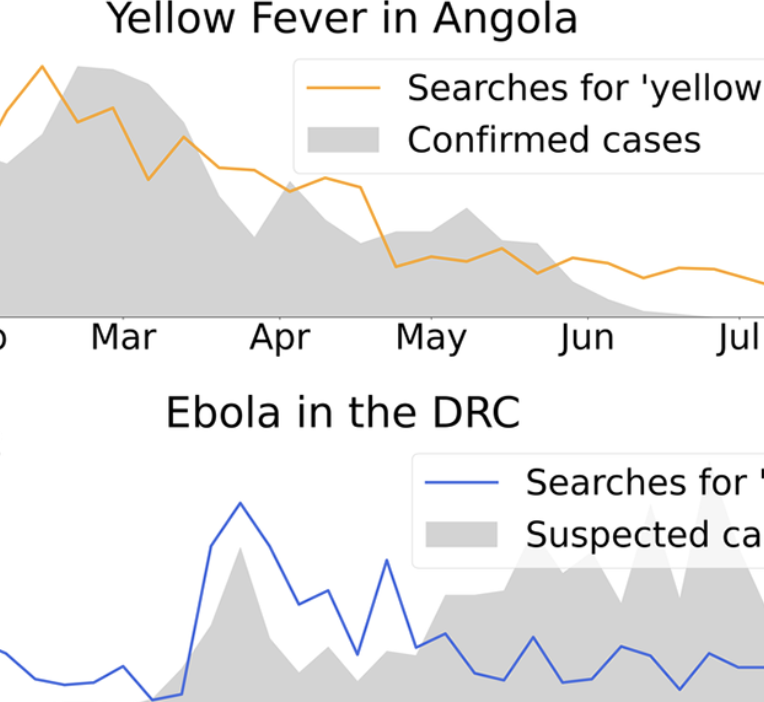
Understanding the behavior of emerging disease outbreaks in, or ahead of, real-time could help healthcare officials better design interventions to mitigate impacts on affected populations. Most healthcare-based disease surveillance systems, however, have significant inherent reporting delays due to data collection, aggregation, and distribution processes. Recent work has shown that machine learning methods leveraging a combination of traditionally collected epidemiological information and novel Internet-based data sources, such as disease-related Internet search activity, can produce meaningful “nowcasts” of disease incidence ahead of healthcare-based estimates, with most successful case studies focusing on endemic and seasonal diseases such as influenza and dengue. Here, we apply similar computational methods to emerging outbreaks in geographic regions where no historical presence of the disease of interest has been observed. By combining limited available historical epidemiological data available with disease-related Internet search activity, we retrospectively estimate disease activity in five recent outbreaks weeks ahead of traditional surveillance methods. We find that the proposed computational methods frequently provide useful real-time incidence estimates that can help fill temporal data gaps resulting from surveillance reporting delays. However, the proposed methods are limited by issues of sample bias and skew in search query volumes, perhaps as a result of media coverage. |
|
Using electronic health records and Internet search information for enhanced influenza forecast
Yang S, Santillana M, Brownstein JS, Gray J, Richardson S, Kou SC. BMC infectious diseases. 2017;17 (1) :332. Abstract
BackgroundAccurate influenza activity forecasting helps public health officials prepare and allocate resources for unusual influenza activity. Traditional flu surveillance systems, such as the Centers for Disease Control and Prevention’s (CDC) influenza-like illnesses reports, lag behind real-time by one to 2 weeks, whereas information contained in cloud-based electronic health records (EHR) and in Internet users’ search activity is typically available in near real-time. We present a method that combines the information from these two data sources with historical flu activity to produce national flu forecasts for the United States up to 4 weeks ahead of the publication of CDC’s flu reports. MethodsWe extend a method originally designed to track flu using Google searches, named ARGO, to combine information from EHR and Internet searches with historical flu activities. Our regularized multivariate regression model dynamically selects the most appropriate variables for flu prediction every week. The model is assessed for the flu seasons within the time period 2013–2016 using multiple metrics including root mean squared error (RMSE). ResultsOur method reduces the RMSE of the publicly available alternative (Healthmap flutrends) method by 33, 20, 17 and 21%, for the four time horizons: real-time, one, two, and 3 weeks ahead, respectively. Such accuracy improvements are statistically significant at the 5% level. Our real-time estimates correctly identified the peak timing and magnitude of the studied flu seasons. ConclusionsOur method significantly reduces the prediction error when compared to historical publicly available Internet-based prediction systems, demonstrating that: (1) the method to combine data sources is as important as data quality; (2) effectively extracting information from a cloud-based EHR and Internet search activity leads to accurate forecast of flu. |
|
Cloud-based Electronic Health Records for Real-time, Region-specific Influenza Surveillance
Santillana M, Nguyen AT, Louie T, Zink A, Gray J, Sung I, Brownstein JS. Scientific reports. 2016;6. Abstract
Accurate real-time monitoring systems of influenza outbreaks help public health officials make informed decisions that may help save lives. We show that information extracted from cloud-based electronic health records databases, in combination with machine learning techniques and historical epidemiological information, have the potential to accurately and reliably provide near real-time regional estimates of flu outbreaks in the United States. |
|
Aggregated mobility data could help fight COVID-19
Buckee CO, Balsari S, Chan J, Crosas M, Dominici F, Gasser U, Grad YH, Grenfell B, Halloran ME, Kraemer MUG, et al. Science. 2020;368 (6487) :145-146. Abstract
As the coronavirus disease 2019 (COVID-19) epidemic worsens, understanding the effectiveness of public messaging and large-scale social distancing interventions is critical. The research and public health response communities can and should use population mobility data collected by private companies, with appropriate legal, organizational, and computational safeguards in place. When aggregated, these data can help refine interventions by providing near real-time information about changes in patterns of human movement. |
|
Incorporating human mobility data improves forecasts of Dengue fever in Thailand
Kiang MV, Santillana M, Chen JT, Onnela J-P, Krieger N, Engø-Monsen K, Ekapirat N, Areechokchai D, Maude R, Buckee CO. Scientific Reports. 2021;11 (923). Abstract
Over 390 million people worldwide are infected with dengue fever each year. In the absence of an effective vaccine for general use, national control programs must rely on hospital readiness and targeted vector control to prepare for epidemics, so accurate forecasting remains an important goal. Many dengue forecasting approaches have used environmental data linked to mosquito ecology to predict when epidemics will occur, but these have had mixed results. Conversely, human mobility, an important driver in the spatial spread of infection, is often ignored. Here we compare time-series forecasts of dengue fever in Thailand, integrating epidemiological data with mobility models generated from mobile phone data. We show that geographically-distant provinces strongly connected by human travel have more highly correlated dengue incidence than weakly connected provinces of the same distance, and that incorporating mobility data improves traditional time-series forecasting approaches. Notably, no single model or class of model always outperformed others. We propose an adaptive, mosaic forecasting approach for early warning systems. |
|
Using heterogeneous data to identify signatures of dengue outbreaks at fine spatio-temporal scales across Brazil
Castro LA, Generous N, Luo W, y Piontti AP, Martinez K, Gomes MFC, Osthus D, Fairchild G, Ziemann A, Vespignani A, et al. PLoS Neglected Tropical Diseases. 2021. Abstract
Dengue virus remains a significant public health challenge in Brazil, and seasonal preparation efforts are hindered by variable intra- and interseasonal dynamics. Here, we present a framework for characterizing weekly dengue activity at the Brazilian mesoregion level from 2010–2016 as time series properties that are relevant to forecasting efforts, focusing on outbreak shape, seasonal timing, and pairwise correlations in magnitude and onset. In addition, we use a combination of 18 satellite remote sensing imagery, weather, clinical, mobility, and census data streams and regression methods to identify a parsimonious set of covariates that explain each time series property. The models explained 54% of the variation in outbreak shape, 38% of seasonal onset, 34% of pairwise correlation in outbreak timing, and 11% of pairwise correlation in outbreak magnitude. Regions that have experienced longer periods of drought sensitivity, as captured by the “normalized burn ratio,” experienced less intense outbreaks, while regions with regular fluctuations in relative humidity had less regular seasonal outbreaks. Both the pairwise correlations in outbreak timing and outbreak trend between mesoresgions were best predicted by distance. Our analysis also revealed the presence of distinct geographic clusters where dengue properties tend to be spatially correlated. Forecasting models aimed at predicting the dynamics of dengue activity need to identify the most salient variables capable of contributing to accurate predictions. Our findings show that successful models may need to leverage distinct variables in different locations and be catered to a specific task, such as predicting outbreak magnitude or timing characteristics, to be useful. This advocates in favor of “adaptive models” rather than “one-size-fits-all” models. The results of this study can be applied to improving spatial hierarchical or target-focused forecasting models of dengue activity across Brazil. |
|
A dynamic, ensemble learning approach to forecast dengue fever epidemic years in Brazil using weather and population susceptibility cycles
McGough S, Kutz NJ, Clemente LC, Santillana M. Journal of the Royal Society Interface. 2021;18 (179) Abstract
Transmission of dengue fever depends on a complex interplay of human, climate and mosquito dynamics, which often change in time and space. It is well known that its disease dynamics are highly influenced by multiple factors including population susceptibility to infection as well as by microclimates: small-area climatic conditions which create environments favourable for the breeding and survival of mosquitoes. Here, we present a novel machine learning dengue forecasting approach, which, dynamically in time and space, identifies local patterns in weather and population susceptibility to make epidemic predictions at the city level in Brazil, months ahead of the occurrence of disease outbreaks. Weather-based predictions are improved when information on population susceptibility is incorporated, indicating that immunity is an important predictor neglected by most dengue forecast models. Given the generalizability of our methodology to any location or input data, it may prove valuable for public health decision-making aimed at mitigating the effects of seasonal dengue outbreaks in locations globally. |
|
Influenza forecasting for French regions combining EHR, web and climatic data sources with a machine learning ensemble approach
Canelle Poirier, Yulin Hswen, Guillaume Bouzillé, Marc Cuggia, Audrey Lavenu, John S Brownstein, Thomas Brewer, Mauricio Santillana. PloS one 16 (5), e02508902021 Abstract
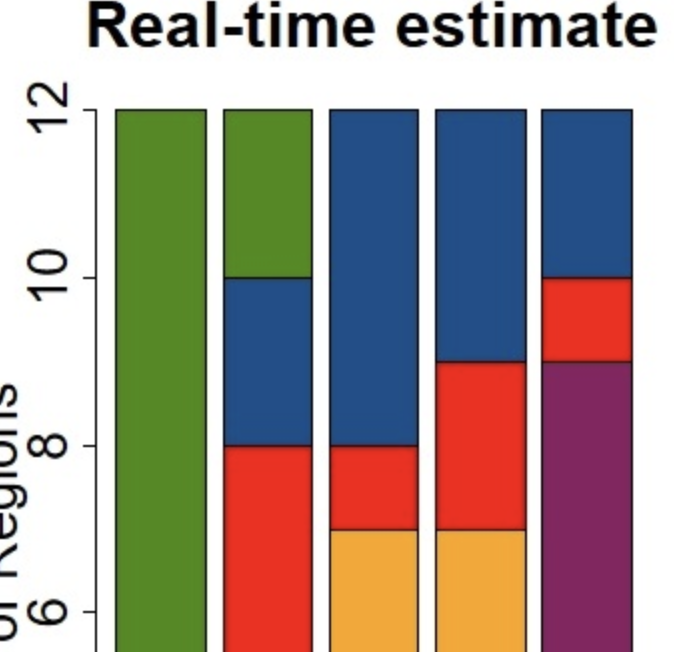
Effective and timely disease surveillance systems have the potential to help public health officials design interventions to mitigate the effects of disease outbreaks. Currently, healthcare-based disease monitoring systems in France offer influenza activity information that lags real-time by one to three weeks. This temporal data gap introduces uncertainty that prevents public health officials from having a timely perspective on the population-level disease activity. Here, we present a machine-learning modeling approach that produces real-time estimates and short-term forecasts of influenza activity for the twelve continental regions of France by leveraging multiple disparate data sources that include, Google search activity, real-time and local weather information, flu-related Twitter micro-blogs, electronic health records data, and historical disease activity synchronicities across regions. Our results show that all data sources contribute to improving influenza surveillance and that machine-learning ensembles that combine all data sources lead to accurate and timely predictions. |
|
High-resolution Spatio-temporal Model for County-level COVID-19 Activity in the US
S Zhu, A Bukharin, L Xie, M Santillana, S Yang, Y Xie ACM Transactions on Management Information Systems (TMIS) 12 (4), 1-20162021 Abstract
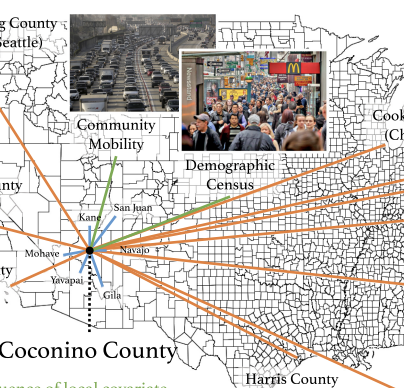
We present an interpretable high-resolution spatio-temporal model to estimate COVID-19 deaths together with confirmed cases 1 week ahead of the current time, at the county level and weekly aggregated, in the United States. A notable feature of our spatio-temporal model is that it considers the (1) temporal auto- and pairwise correlation of the two local time series (confirmed cases and deaths from the COVID-19), (2) correlation between locations (propagation between counties), and (3) covariates such as local within-community mobility and social demographic factors. The within-community mobility and demographic factors, such as total population and the proportion of the elderly, are included as important predictors since they are hypothesized to be important in determining the dynamics of COVID-19. To reduce the model’s high dimensionality, we impose sparsity structures as constraints and emphasize the impact of the top 10 metropolitan areas in the nation, which we refer to (and treat within our models) as hubs in spreading the disease. Our retrospective out-of-sample county-level predictions were able to forecast the subsequently observed COVID-19 activity accurately. The proposed multivariate predictive models were designed to be highly interpretable, with clear identification and quantification of the most important factors that determine the dynamics of COVID-19. Ongoing work involves incorporating more covariates, such as education and income, to improve prediction accuracy and model interpretability. |
|
A nowcasting framework for correcting for reporting delays in malaria surveillance
Tigist F Menkir, Horace Cox, Canelle Poirier, Melanie Saul, Sharon Jones-Weekes, Collette Clementson, Pablo M. de Salazar, Mauricio Santillana, Caroline O Buckee. PLoS Computational Biology 17 (11), e10095702021 Abstract
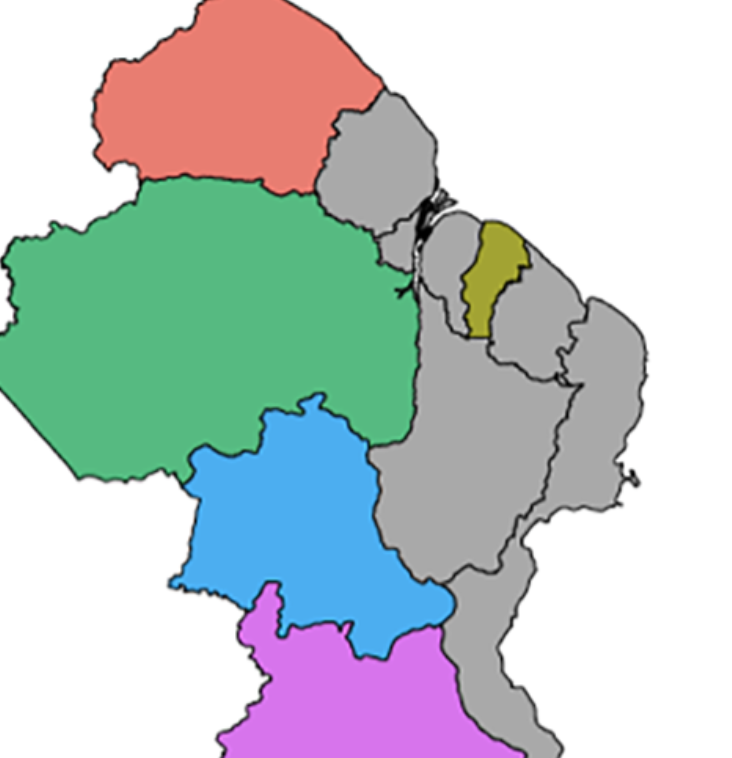
Time lags in reporting to national surveillance systems represent a major barrier for the control of infectious diseases, preventing timely decision making and resource allocation. This issue is particularly acute for infectious diseases like malaria, which often impact rural and remote communities the hardest. In Guyana, a country located in South America, poor connectivity among remote malaria-endemic regions hampers surveillance efforts, making reporting delays a key challenge for elimination. Here, we analyze 13 years of malaria surveillance data, identifying key correlates of time lags between clinical cases occurring and being added to the central data system. We develop nowcasting methods that use historical patterns of reporting delays to estimate occurred-but-not-reported monthly malaria cases. To assess their performance, we implemented them retrospectively, using only information that would have been available at the time of estimation, and found that they substantially enhanced the estimates of malaria cases. Specifically, we found that the best performing models achieved up to two-fold improvements in accuracy (or error reduction) over known cases in selected regions. Our approach provides a simple, generalizable tool to improve malaria surveillance in endemic countries and is currently being implemented to help guide existing resource allocation and elimination efforts. |
|
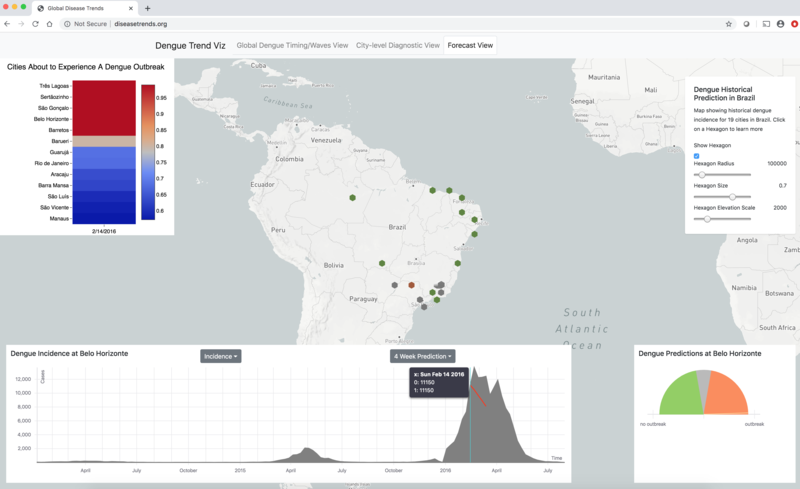
Predicting dengue incidence leveraging internet-based data sources. A case study in 20 cities in Brazil
G Koplewitz, F Lu, L Clemente, C Buckee, M Santillana PLoS neglected tropical diseases 16 (1), e00100712022 Abstract
The dengue virus affects millions of people every year worldwide, causing large epidemic outbreaks that disrupt people’s lives and severely strain healthcare systems. In the absence of a reliable vaccine against dengue or an effective treatment to manage the illness in humans, most efforts to combat dengue infections have focused on preventing its vectors, mainly the Aedes aegypti mosquito, from flourishing across the world. These mosquito-control strategies need reliable disease activity surveillance systems to be deployed. Despite significant efforts to estimate dengue incidence using a variety of data sources and methods, little work has been done to understand the relative contribution of the different data sources to improved prediction. Additionally, scholarship on the topic had initially focused on prediction systems at the national- and state-levels, and much remains to be done at the finer spatial resolutions at which health policy interventions often occur. We develop a methodological framework to assess and compare dengue incidence estimates at the city level, and evaluate the performance of a collection of models on 20 different cities in Brazil. The data sources we use towards this end are weekly incidence counts from prior years (seasonal autoregressive terms), weekly-aggregated weather variables, and real-time internet search data. We find that both random forest-based models and LASSO regression-based models effectively leverage these multiple data sources to produce accurate predictions, and that while the performance between them is comparable on average, the former method produces fewer extreme outliers, and can thus be considered more robust. For real-time predictions that assume long delays (6–8 weeks) in the availability of epidemiological data, we find that real-time internet search data are the strongest predictors of dengue incidence, whereas for predictions that assume short delays (1–3 weeks), in which the error rate is halved (as measured by relative RMSE), short-term and seasonal autocorrelation are the dominant predictors. Despite the difficulties inherent to city-level prediction, our framework achieves meaningful and actionable estimates across cities with different demographic, geographic and epidemic characteristics. |
|
Fitbit-informed influenza forecasts
Viboud C, Santillana M. Lancet Digital Health. 2020;2 (2). Abstract
Over the past two decades, widespread adoption of mobile phone technology has facilitated the real-time acquisition of individual-level data on human behaviour. Mobile technologies have helped to improve geographical navigation, facilitated the exchange of goods and money, accelerated information transfer, and strengthened predictions for the spread of infectious diseases.1, 2, 3. The rise of portable health-monitoring devices has also allowed individuals to track their vital signs and sleep patterns, generating a trove of information to monitor population health. |
|
Leveraging Google Search Data to Track Influenza Outbreaks in Africa
Mejia K, Viboud C, Santillana M. Gates Open Research. 2019;3 :1653. Abstract
Background: Traditionally, public health agencies track seasonal influenza activity by collecting information from clinics, hospitals, and laboratories. The inherent slowness of the processes used to collect influenza activity data limits the ability of public health agencies to adapt to unexpected changes in influenza activity in near real-time. In recent years, new influenza surveillance methods that use nontraditional data sources, such as Google searches, have been proposed to successfully estimate influenza activity in near real-time. However, most of these methods have been designed for and implemented in high-income countries even though influenza disease burden remains high in low- to middle-income countries. Here, we seek to predict influenza activity in near real-time in Africa using machine learning models that combine Google searches with traditional epidemiological data. Methods: We extend the AutoRegression with Google search data (ARGO) model to track influenza activity in near-real-time in Africa. The ARGO model, which was originally designed to predict influenza activity in the United States, combines influenza-related Google searches with historical laboratory-confirmed influenza trends. We evaluate the predictive performance of the ARGO model and compare it with several benchmark models in Algeria, Ghana, Morocco, and South Africa. We also explore the advantages and limitations of using Google search data to monitor influenza activity. Results: In South Africa, Algeria, and Morocco, the ARGO model outperforms all benchmark models, suggesting that incorporating influenza-related Google search information in predictive models in these countries leads to improved predictions. In Ghana, however, the ARGO model and the autoregressive model of historical influenza activity have comparable performances. Conclusions: These results demonstrate that the quality of the ARGO predictions is higher in regions where influenza activity is seasonal, historical influenza activity is recorded consistently, and the volume of influenza-related Google search queries is enough to appear as non-zero in the Google Trends tool. |
|
Chikungunya virus outbreak in the Amazon region: replacement of the Asian genotype by an ECSA lineage
Naveca FG, Claro I, Giovanetti M, Jesus JG, Javier J, Iani FCM, do Nascimento VA, Souza VC, Silveira PP, Lourenco J, et al. PLoS Neglected Tropical Diseases. 2019;13 (3) :e0007065. Abstract
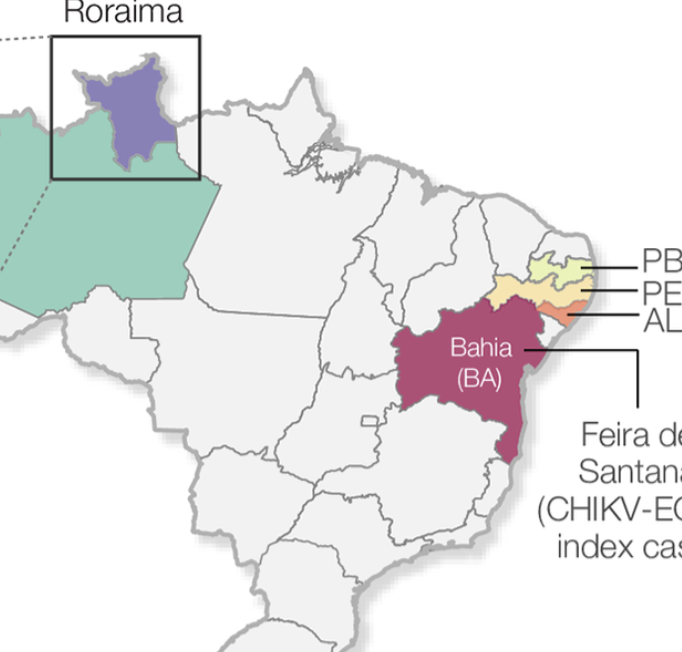
BackgroundSince its first detection in the Caribbean in late 2013, chikungunya virus (CHIKV) has affected 51 countries in the Americas. The CHIKV epidemic in the Americas was caused by the CHIKV-Asian genotype. In August 2014, local transmission of the CHIKV-Asian genotype was detected in the Brazilian Amazon region. However, a distinct lineage, the CHIKV-East-Central-South-America (ECSA)-genotype, was detected nearly simultaneously in Feira de Santana, Bahia state, northeast Brazil. The genomic diversity and the dynamics of CHIKV in the Brazilian Amazon region remains poorly understood despite its importance to better understand the epidemiological spread and public health impact of CHIKV in the country. Methodology/Principal findingsWe report a large CHIKV outbreak (5,928 notified cases between August 2014 and August 2018) in Boa vista municipality, capital city of Roraima’s state, located in the Brazilian Amazon region. We generated 20 novel CHIKV-ECSA genomes from the Brazilian Amazon region using MinION portable genome sequencing. Phylogenetic analyses revealed that despite an early introduction of the Asian genotype in 2015 in Roraima, the large CHIKV outbreak in 2017 in Boa Vista was caused by an ECSA-lineage most likely introduced from northeastern Brazil. Epidemiological analyses suggest a basic reproductive number of R0 of 1.66, which translates in an estimated 39 (95% CI: 36 to 45) % of Roraima’s population infected with CHIKV-ECSA. Finally, we find a strong association between Google search activity and the local laboratory-confirmed CHIKV cases in Roraima. Conclusions/SignificanceThis study highlights the potential of combining traditional surveillance with portable genome sequencing technologies and digital epidemiology to inform public health surveillance in the Amazon region. Our data reveal a large CHIKV-ECSA outbreak in Boa Vista, limited potential for future CHIKV outbreaks, and indicate a replacement of the Asian genotype by the ECSA genotype in the Amazon region. |
|
Improved real-time influenza surveillance using Internet search data in eight Latin American countries
Clemente LC, Lu F, Santillana M. JMIR Public Health Surveillance. 2019;5 (2) :e12214. Abstract
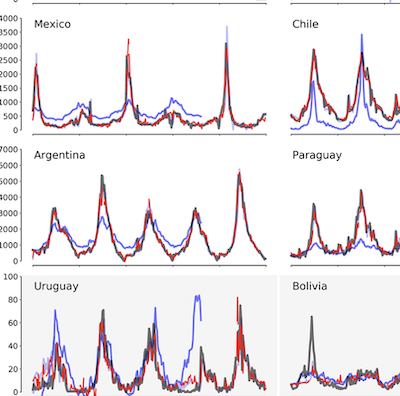
Background:Novel influenza surveillance systems that leverage Internet-based real-time data sources including Internet search frequencies, social-network information, and crowd-sourced flu surveillance tools have shown improved accuracy over the past few years in data-rich countries like the United States. These systems not only track flu activity accurately, but they also report flu estimates a week or more ahead of the publication of reports produced by healthcare-based systems, such as those implemented and managed by the Centers for Disease Control and Prevention. Previous work has shown that the predictive capabilities of novel flu surveillance systems, like Google Flu Trends (GFT), in developing countries in Latin America have not yet delivered acceptable flu estimates. Objective:The aim of this study was to show that recent methodological improvements on the use of Internet search engine information to track diseases can lead to improved retrospective flu estimates in multiple countries in Latin America. Methods:A machine learning-based methodology that uses flu-related Internet search activity and historical information to monitor flu activity, named ARGO (AutoRegression with Google search), was extended to generate flu predictions for 8 Latin American countries (Argentina, Bolivia, Brazil, Chile, Mexico, Paraguay, Peru, and Uruguay) for the time period: January 2012 to December of 2016. These retrospective (out-of-sample) Influenza activity predictions were compared with historically observed flu suspected cases in each country, as reported by Flunet, an influenza surveillance database maintained by the World Health Organization. For a baseline comparison, retrospective (out-of-sample) flu estimates were produced for the same time period using autoregressive models that only leverage historical flu activity information. Results:Our results show that ARGO-like models’ predictive power outperform autoregressive models in 6 out of 8 countries in the 2012-2016 time period. Moreover, ARGO significantly improves on historical flu estimates produced by the now discontinued GFT for the time period of 2012-2015, where GFT information is publicly available. Conclusions:We demonstrate here that a self-correcting machine learning method, leveraging Internet-based disease-related search activity and historical flu trends, has the potential to produce reliable and timely flu estimates in multiple Latin American countries. This methodology may prove helpful to local public health officials who design and implement interventions aimed at mitigating the effects of influenza outbreaks. Our methodology generally outperforms both the now-discontinued tool GFT, and autoregressive methodologies that exploit only historical flu activity to produce future disease estimates. |
|
Combining Participatory Influenza Surveillance with Modeling and Forecasting
Marathe A, Brownstein JS, Chu S, Marathe MV, Nguyen AT, Paolotti D, Perra N, Perrotta D, Santillana M, Swarup S, et al. Journal of Medical Internet Research Public Health Surveillance. 2017;3 (4) :e83. Abstract
Background:Influenza outbreaks affect millions of people every year and its surveillance is usually carried out in developed countries through a network of sentinel doctors who report the weekly number of Influenza-like Illness cases observed among the visited patients. Monitoring and forecasting the evolution of these outbreaks supports decision makers in designing effective interventions and allocating resources to mitigate their impact. Objective:Describe the existing participatory surveillance approaches that have been used for modeling and forecasting of the seasonal influenza epidemic, and how they can help strengthen real-time epidemic science and provide a more rigorous understanding of epidemic conditions. Methods:We describe three different participatory surveillance systems, WISDM (Widely Internet Sourced Distributed Monitoring), Influenzanet and Flu Near You (FNY), and show how modeling and simulation can be or has been combined with participatory disease surveillance to: i) measure the non-response bias in a participatory surveillance sample using WISDM; and ii) nowcast and forecast influenza activity in different parts of the world (using Influenzanet and Flu Near You). Results:WISDM-based results measure the participatory and sample bias for three epidemic metrics i.e. attack rate, peak infection rate, and time-to-peak, and find the participatory bias to be the largest component of the total bias. The Influenzanet platform shows that digital participatory surveillance data combined with a realistic data-driven epidemiological model can provide both short-term and long-term forecasts of epidemic intensities, and the ground truth data lie within the 95 percent confidence intervals for most weeks. The statistical accuracy of the ensemble forecasts increase as the season progresses. The Flu Near You platform shows that participatory surveillance data provide accurate short-term flu activity forecasts and influenza activity predictions. The correlation of the HealthMap Flu Trends estimates with the observed CDC ILI rates is 0.99 for 2013-2015. Additional data sources lead to an error reduction of about 40% when compared to the estimates of the model that only incorporates CDC historical information. Conclusions:While the advantages of participatory surveillance, compared to traditional surveillance, include its timeliness, lower costs, and broader reach, it is limited by a lack of control over the characteristics of the population sample. Modeling and simulation can help overcome this limitation as well as provide real-time and long-term forecasting of influenza activity in data-poor parts of the world. |

