Background: Traditionally, public health agencies track seasonal influenza activity by collecting information from clinics, hospitals, and laboratories. The inherent slowness of the processes used to collect influenza activity data limits the ability of public health agencies to adapt to unexpected changes in influenza activity in near real-time. In recent years, new influenza surveillance methods that use nontraditional data sources, such as Google searches, have been proposed to successfully estimate influenza activity in near real-time. However, most of these methods have been designed for and implemented in high-income countries even though influenza disease burden remains high in low- to middle-income countries. Here, we seek to predict influenza activity in near real-time in Africa using machine learning models that combine Google searches with traditional epidemiological data. Methods: We extend the AutoRegression with Google search data (ARGO) model to track influenza activity in near-real-time in Africa. The ARGO model, which was originally designed to predict influenza activity in the United States, combines influenza-related Google searches with historical laboratory-confirmed influenza trends. We evaluate the predictive performance of the ARGO model and compare it with several benchmark models in Algeria, Ghana, Morocco, and South Africa. We also explore the advantages and limitations of using Google search data to monitor influenza activity. Results: In South Africa, Algeria, and Morocco, the ARGO model outperforms all benchmark models, suggesting that incorporating influenza-related Google search information in predictive models in these countries leads to improved predictions. In Ghana, however, the ARGO model and the autoregressive model of historical influenza activity have comparable performances. Conclusions: These results demonstrate that the quality of the ARGO predictions is higher in regions where influenza activity is seasonal, historical influenza activity is recorded consistently, and the volume of influenza-related Google search queries is enough to appear as non-zero in the Google Trends tool.
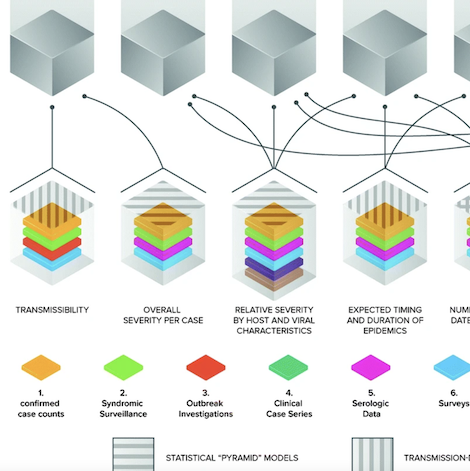
Catastrophic epidemics, if they occur, will very likely start from localized and far smaller (noncatastrophic) outbreaks that grow into much greater threats. One key bulwark against this outcome is the ability of governments and the health sector more generally to make informed decisions about control measures based on accurate understanding of the current and future extent of the outbreak. Situation reporting is the activity of periodically summarizing the state of the outbreak in a (usually) public way. We delineate key classes of decisions whose quality depends on high-quality situation reporting, key quantities for which estimates are needed to inform these decisions, and the traditional and novel sources of data that can aid in estimating these quantities. We emphasize the important role of situation reports as providing public, shared planning assumptions that allow decision makers to harmonize the response while making explicit the uncertainties that underlie the scenarios outlined for planning. In this era of multiple data sources and complex factors informing the interpretation of these data sources, we describe four principles for situation reporting:1. Situation reporting should be thematic, concentrating on essential areas of evidence needed for decisions. 2. Situation reports should adduce evidence from multiple sources to address each area of evidence, along with expert assessments of key parameters. 3. Situation reports should acknowledge uncertainty and attempt to estimate its magnitude for each assessment.4. Situation reports should contain carefully curated visualizations along with text and tables.
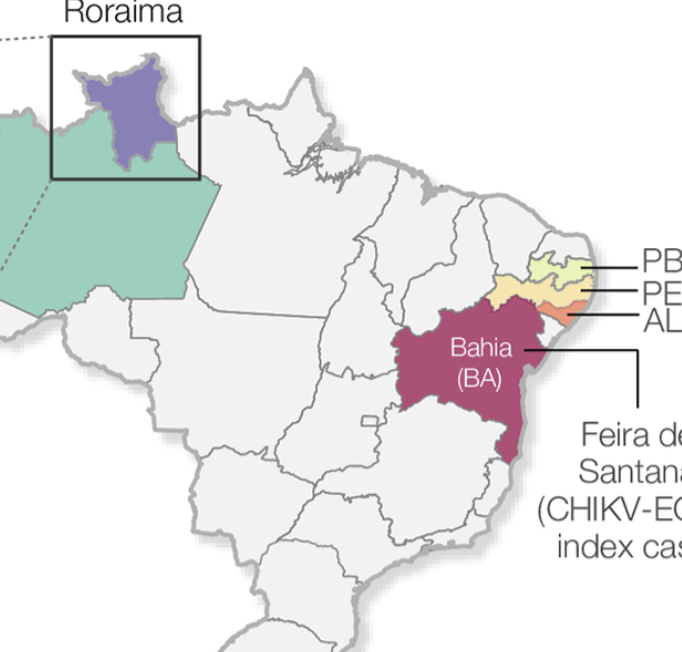
BackgroundSince its first detection in the Caribbean in late 2013, chikungunya virus (CHIKV) has affected 51 countries in the Americas. The CHIKV epidemic in the Americas was caused by the CHIKV-Asian genotype. In August 2014, local transmission of the CHIKV-Asian genotype was detected in the Brazilian Amazon region. However, a distinct lineage, the CHIKV-East-Central-South-America (ECSA)-genotype, was detected nearly simultaneously in Feira de Santana, Bahia state, northeast Brazil. The genomic diversity and the dynamics of CHIKV in the Brazilian Amazon region remains poorly understood despite its importance to better understand the epidemiological spread and public health impact of CHIKV in the country. Methodology/Principal findingsWe report a large CHIKV outbreak (5,928 notified cases between August 2014 and August 2018) in Boa vista municipality, capital city of Roraima’s state, located in the Brazilian Amazon region. We generated 20 novel CHIKV-ECSA genomes from the Brazilian Amazon region using MinION portable genome sequencing. Phylogenetic analyses revealed that despite an early introduction of the Asian genotype in 2015 in Roraima, the large CHIKV outbreak in 2017 in Boa Vista was caused by an ECSA-lineage most likely introduced from northeastern Brazil. Epidemiological analyses suggest a basic reproductive number of R0 of 1.66, which translates in an estimated 39 (95% CI: 36 to 45) % of Roraima’s population infected with CHIKV-ECSA. Finally, we find a strong association between Google search activity and the local laboratory-confirmed CHIKV cases in Roraima. Conclusions/SignificanceThis study highlights the potential of combining traditional surveillance with portable genome sequencing technologies and digital epidemiology to inform public health surveillance in the Amazon region. Our data reveal a large CHIKV-ECSA outbreak in Boa Vista, limited potential for future CHIKV outbreaks, and indicate a replacement of the Asian genotype by the ECSA genotype in the Amazon region.
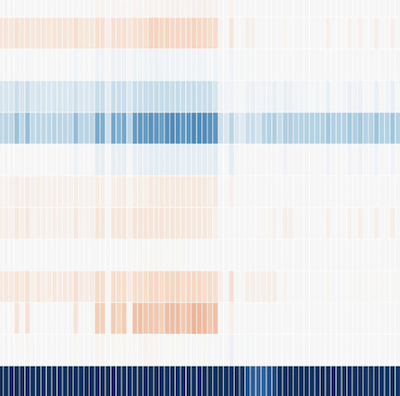
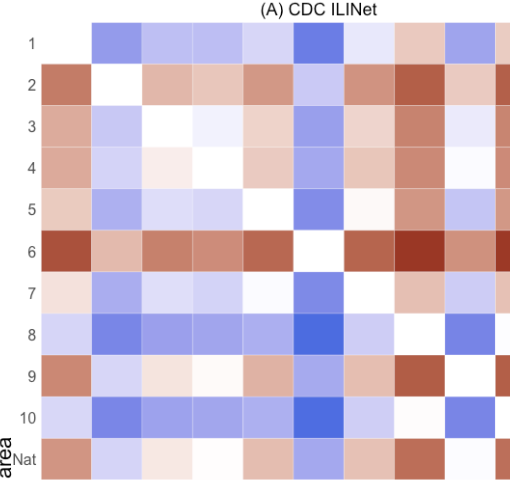
Background:The Centers for Disease Control and Prevention (CDC) tracks influenza-like illness (ILI) using information on patient visits to health care providers through the Outpatient Influenza-like Illness Surveillance Network (ILINet). As participation in this system is voluntary, the composition, coverage, and consistency of health care reports vary from state to state, leading to different measures of ILI activity between regions. The degree to which these measures reflect actual differences in influenza activity or systematic differences in the methods used to collect and aggregate the data is unclear. Objective:The objective of our study was to qualitatively and quantitatively compare national and region-specific ILI activity in the United States across 4 surveillance data sources—CDC ILINet, Flu Near You (FNY), athenahealth, and HealthTweets.org—to determine whether these data sources, commonly used as input in influenza modeling efforts, show geographical patterns that are similar to those observed in CDC ILINet’s data. We also compared the yearly percentage of FNY participants who sought health care for ILI symptoms across geographical areas. Methods:We compared the national and regional 2018-2019 ILI activity baselines, calculated using noninfluenza weeks from previous years, for each surveillance data source. We also compared measures of ILI activity across geographical areas during 3 influenza seasons, 2015-2016, 2016-2017, and 2017-2018. Geographical differences in weekly ILI activity within each data source were also assessed using relative mean differences and time series heatmaps. National and regional age-adjusted health care–seeking percentages were calculated for each influenza season by dividing the number of FNY participants who sought medical care for ILI symptoms by the total number of ILI reports within an influenza season. Pearson correlations were used to assess the association between the health care–seeking percentages and baselines for each surveillance data source. Results:We observed consistent differences in ILI activity across geographical areas for CDC ILINet and athenahealth data. ILI activity for FNY displayed little variation across geographical areas, whereas differences in ILI activity for HealthTweets.org were associated with the total number of tweets within a geographical area. The percentage of FNY participants who sought health care for ILI symptoms differed slightly across geographical areas, and these percentages were positively correlated with CDC ILINet and athenahealth baselines. Conclusions:Our findings suggest that differences in ILI activity across geographical areas as reported by a given surveillance system may not accurately reflect true differences in the prevalence of ILI. Instead, these differences may reflect systematic collection and aggregation biases that are particular to each system and consistent across influenza seasons. These findings are potentially relevant in the real-time analysis of the influenza season and in the definition of unbiased forecast models.
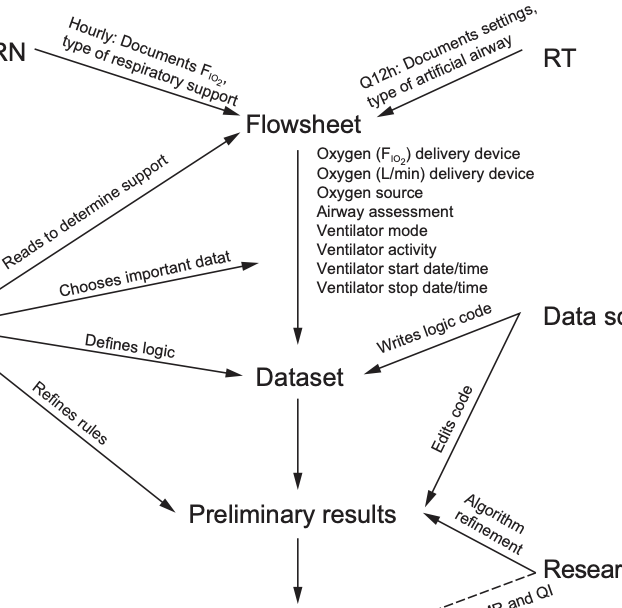
BACKGROUND: Noninvasive ventilation (NIV) is commonly used to support children with respiratory failure, but detailed patterns of real-world use are lacking. The aim of our study was to describe use patterns of NIV via electronic medical record (EMR) data. METHODS: We performed a retrospective electronic chart review in a tertiary care pediatric ICU in the United States. Subjects admitted to the pediatric ICU from 2014 to 2017 who were mechanically ventilated were included in the study. RESULTS: The median number of discrete device episodes, defined as a time on support without interruption, was 20 (interquartile range [IQR] 8–49) per subject. The median duration of bi-level positive airway pressure (BPAP) support prior to interruption was 6.3 h (IQR 2.4–10.4); the median duration of CPAP was 6 h (IQR 2.1–10.4). Interruptions to BPAP had a median duration of 6.3 h (IQR 2–15.5); interruptions to CPAP had a median duration of 8.6 h (IQR 2.2–16.8). Use of NIV followed a diurnal pattern, with 44% of BPAP and 42% of CPAP subjects initiating support between 7:00 PM and midnight, and 49% of BPAP and 46% of CPAP subjects stopping support between 5:00 AM and 10:00 AM CONCLUSIONS: NIV was frequently interrupted, and initiation and discontinuation of NIV follows a diurnal pattern. Use of EMR data collected for routine clinical care allowed the analysis of granular details of typical use patterns. Understanding NIV use patterns may be particularly important to understanding the burden of pediatric ICU bed utilization for nocturnal NIV. To our knowledge, this is the first study to examine in detail the use of pediatric NIV and to define diurnal use and frequent interruptions to support.
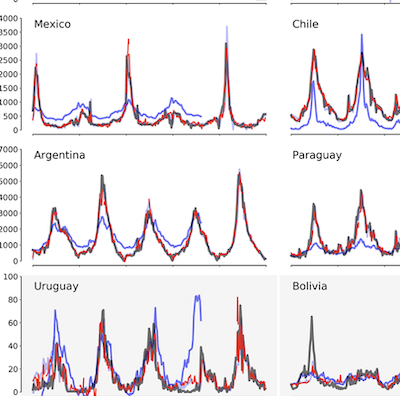
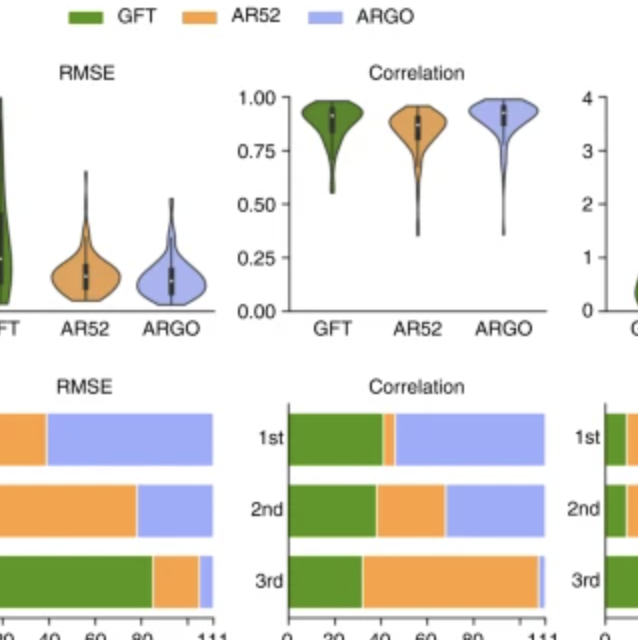
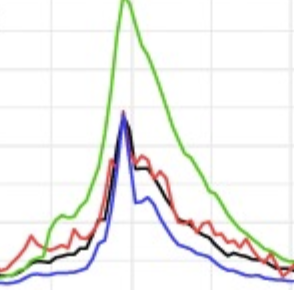
Background:Novel influenza surveillance systems that leverage Internet-based real-time data sources including Internet search frequencies, social-network information, and crowd-sourced flu surveillance tools have shown improved accuracy over the past few years in data-rich countries like the United States. These systems not only track flu activity accurately, but they also report flu estimates a week or more ahead of the publication of reports produced by healthcare-based systems, such as those implemented and managed by the Centers for Disease Control and Prevention. Previous work has shown that the predictive capabilities of novel flu surveillance systems, like Google Flu Trends (GFT), in developing countries in Latin America have not yet delivered acceptable flu estimates. Objective:The aim of this study was to show that recent methodological improvements on the use of Internet search engine information to track diseases can lead to improved retrospective flu estimates in multiple countries in Latin America. Methods:A machine learning-based methodology that uses flu-related Internet search activity and historical information to monitor flu activity, named ARGO (AutoRegression with Google search), was extended to generate flu predictions for 8 Latin American countries (Argentina, Bolivia, Brazil, Chile, Mexico, Paraguay, Peru, and Uruguay) for the time period: January 2012 to December of 2016. These retrospective (out-of-sample) Influenza activity predictions were compared with historically observed flu suspected cases in each country, as reported by Flunet, an influenza surveillance database maintained by the World Health Organization. For a baseline comparison, retrospective (out-of-sample) flu estimates were produced for the same time period using autoregressive models that only leverage historical flu activity information. Results:Our results show that ARGO-like models’ predictive power outperform autoregressive models in 6 out of 8 countries in the 2012-2016 time period. Moreover, ARGO significantly improves on historical flu estimates produced by the now discontinued GFT for the time period of 2012-2015, where GFT information is publicly available. Conclusions:We demonstrate here that a self-correcting machine learning method, leveraging Internet-based disease-related search activity and historical flu trends, has the potential to produce reliable and timely flu estimates in multiple Latin American countries. This methodology may prove helpful to local public health officials who design and implement interventions aimed at mitigating the effects of influenza outbreaks. Our methodology generally outperforms both the now-discontinued tool GFT, and autoregressive methodologies that exploit only historical flu activity to produce future disease estimates.
In the presence of health threats, precision public health approaches aim to provide targeted, timely, and population-specific interventions. Accurate surveillance methodologies that can estimate infectious disease activity ahead of official healthcare-based reports, at relevant spatial resolutions, are important for achieving this goal. Here we introduce a methodological framework which dynamically combines two distinct influenza tracking techniques, using an ensemble machine learning approach, to achieve improved state-level influenza activity estimates in the United States. The two predictive techniques behind the ensemble utilize (1) a self-correcting statistical method combining influenza-related Google search frequencies, information from electronic health records, and historical flu trends within each state, and (2) a network-based approach leveraging spatio-temporal synchronicities observed in historical influenza activity across states. The ensemble considerably outperforms each component method in addition to previously proposed state-specific methods for influenza tracking, with higher correlations and lower prediction errors.
ObjectiveEmergency departments (EDs) are increasingly overcrowded. Forecasting patient visit volume is challenging. Reliable and accurate forecasting strategies may help improve resource allocation and mitigate the effects of overcrowding. Patterns related to weather, day of the week, season, and holidays have been previously used to forecast ED visits. Internet search activity has proven useful for predicting disease trends and offers a new opportunity to improve ED visit forecasting. This study tests whether Google search data and relevant statistical methods can improve the accuracy of ED volume forecasting compared with traditional data sources.
Materials and MethodsSeven years of historical daily ED arrivals were collected from Boston Children’s Hospital. We used data from the public school calendar, National Oceanic and Atmospheric Administration, and Google Trends. Multiple linear models using LASSO (least absolute shrinkage and selection operator) for variable selection were created. The models were trained on 5 years of data and out-of-sample accuracy was judged using multiple error metrics on the final 2 years.
ResultsAll data sources added complementary predictive power. Our baseline day-of-the-week model recorded average percent errors of 10.99%. Autoregressive terms, calendar and weather data reduced errors to 7.71%. Search volume data reduced errors to 7.58% theoretically preventing 4 improperly staffed days.
DiscussionThe predictive power provided by the search volume data may stem from the ability to capture population-level interaction with events, such as winter storms and infectious diseases, that traditional data sources alone miss.
ConclusionsThis study demonstrates that search volume data can meaningfully improve forecasting of ED visit volume and could help improve quality and reduce cost.
Introduction: Between August and November 2017, Madagascar reported nearly 2500 cases of plague; the vast majority of these cases were pneumonic, resulting in early exponential growth due to person-to-person transmission. Though plague is endemic in Madagascar, cases are usually bubonic and thus result in considerably smaller annual caseloads than those observed from August–November 2017. Methods: In this study, we consider the transmission dynamics of pneumonic plague in Madagascar during this time period, as well as the role of control strategies that were deployed to curb the outbreak and their effectiveness. Results: When using data from the beginning of the outbreak through late November 2017, our estimates for the basic reproduction number range from 1.6 to 3.6, with a mean of 2.4. We also find two distinctive periods of “control”, which coincide with critical on-the-ground interventions, including contact tracing and delivery of antibiotics, among others. Discussion: Given these results, we conclude that existing interventions remain effective against plague in Madagascar, despite the atypical size and spread of this particular outbreak.
Background: Influenza causes an estimated 3000 to 50,000 deaths per year in the United States of America (US). Timely and representative data can help local, state, and national public health officials monitor and respond to outbreaks of seasonal influenza. Data from cloud-based electronic health records (EHR) and crowd-sourced influenza surveillance systems have the potential to provide complementary, near real-time estimates of influenza activity. The objectives of this paper are to compare two novel influenza-tracking systems with three traditional healthcare-based influenza surveillance systems at four spatial resolutions: national, regional, state, and city, and to determine the minimum number of participants in these systems required to produce influenza activity estimates that resemble the historical trends recorded by traditional surveillance systems. Methods: We compared influenza activity estimates from five influenza surveillance systems: 1) patient visits for influenza-like illness (ILI) from the US Outpatient ILI Surveillance Network (ILINet), 2) virologic data from World Health Organization (WHO) Collaborating and National Respiratory and Enteric Virus Surveillance System (NREVSS) Laboratories, 3) Emergency Department (ED) syndromic surveillance from Boston, Massachusetts, 4) patient visits for ILI from EHR, and 5) reports of ILI from the crowd-sourced system, Flu Near You (FNY), by calculating correlations between these systems across four influenza seasons, 2012-16, at four different spatial resolutions in the US. For the crowd-sourced system, we also used a bootstrapping statistical approach to estimate the minimum number of reports necessary to produce a meaningful signal at a given spatial resolution. Results: In general, as the spatial resolution increased, correlation values between all influenza surveillance systems decreased. Influenza-like Illness rates in geographic areas with more than 250 crowd-sourced participants or with more than 20,000 visit counts for EHR tracked government-lead estimates of influenza activity. Conclusions: With a sufficient number of reports, data from novel influenza surveillance systems can complement traditional healthcare-based systems at multiple spatial resolutions.
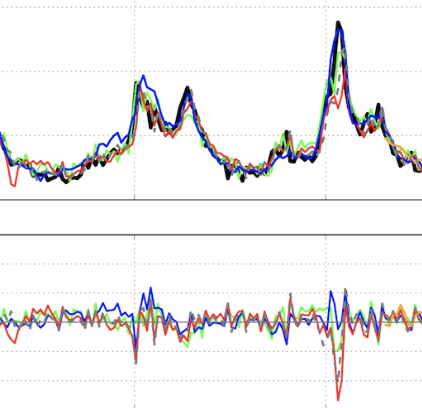
Background:Influenza outbreaks pose major challenges to public health around the world, leading to thousands of deaths a year in the United States alone. Accurate systems that track influenza activity at the city level are necessary to provide actionable information that can be used for clinical, hospital, and community outbreak preparation. Objective:Although Internet-based real-time data sources such as Google searches and tweets have been successfully used to produce influenza activity estimates ahead of traditional health care–based systems at national and state levels, influenza tracking and forecasting at finer spatial resolutions, such as the city level, remain an open question. Our study aimed to present a precise, near real-time methodology capable of producing influenza estimates ahead of those collected and published by the Boston Public Health Commission (BPHC) for the Boston metropolitan area. This approach has great potential to be extended to other cities with access to similar data sources. Methods:We first tested the ability of Google searches, Twitter posts, electronic health records, and a crowd-sourced influenza reporting system to detect influenza activity in the Boston metropolis separately. We then adapted a multivariate dynamic regression method named ARGO (autoregression with general online information), designed for tracking influenza at the national level, and showed that it effectively uses the above data sources to monitor and forecast influenza at the city level 1 week ahead of the current date. Finally, we presented an ensemble-based approach capable of combining information from models based on multiple data sources to more robustly nowcast as well as forecast influenza activity in the Boston metropolitan area. The performances of our models were evaluated in an out-of-sample fashion over 4 influenza seasons within 2012-2016, as well as a holdout validation period from 2016 to 2017. Results:Our ensemble-based methods incorporating information from diverse models based on multiple data sources, including ARGO, produced the most robust and accurate results. The observed Pearson correlations between our out-of-sample flu activity estimates and those historically reported by the BPHC were 0.98 in nowcasting influenza and 0.94 in forecasting influenza 1 week ahead of the current date. Conclusions:We show that information from Internet-based data sources, when combined using an informed, robust methodology, can be effectively used as early indicators of influenza activity at fine geographic resolutions.
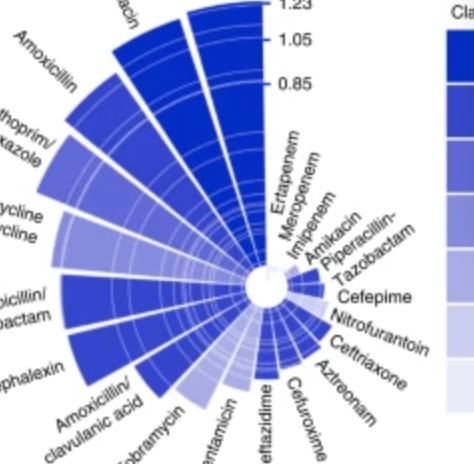
Bacteria that cause infections in humans can develop or acquire resistance to antibiotics commonly used against them1,2. Antimicrobial resistance (in bacteria and other microbes) causes significant morbidity worldwide, and some estimates indicate the attributable mortality could reach up to 10 million by 20502,3,4. Antibiotic resistance in bacteria is believed to develop largely under the selective pressure of antibiotic use; however, other factors may contribute to population level increases in antibiotic resistance1,2. We explored the role of climate (temperature) and additional factors on the distribution of antibiotic resistance across the United States, and here we show that increasing local temperature as well as population density are associated with increasing antibiotic resistance (percent resistant) in common pathogens. We found that an increase in temperature of 10 °C across regions was associated with an increases in antibiotic resistance of 4.2%, 2.2%, and 2.7% for the common pathogens Escherichia coli, Klebsiella pneumoniae and Staphylococcus aureus. The associations between temperature and antibiotic resistance in this ecological study are consistent across most classes of antibiotics and pathogens and may be strengthening over time. These findings suggest that current forecasts of the burden of antibiotic resistance could be significant underestimates in the face of a growing population and climate change4.
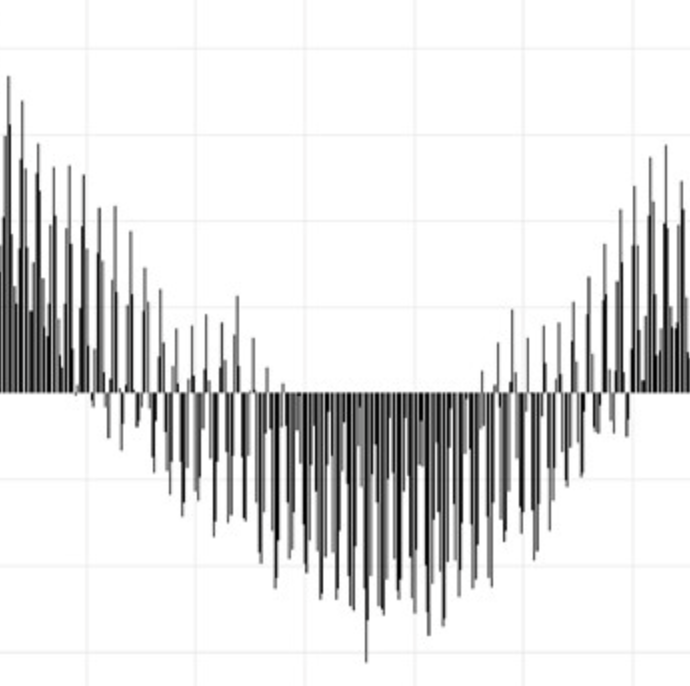
Mathematical models are often regarded as recent innovations in the description and analysis of infectious disease outbreaks and epidemics, but simple mathematical expressions have been in use for projection of epidemic trajectories for more than a century. We recently introduced a single equation model (the incidence decay with exponential adjustment, or IDEA model) that can be used for short-term epidemiological forecasting. In the mid-19th century, Dr. William Farr made the observation that epidemic events rise and fall in a roughly symmetrical pattern that can be approximated by a bell-shaped curve. He noticed that this time-evolution behavior could be captured by a single mathematical formula (“Farr's law”) that could be used for epidemic forecasting. We show here that the IDEA model follows Farr's law, and show that for intuitive assumptions, Farr's Law can be derived from the IDEA model. Moreover, we show that both mathematical approaches, Farr's Law and the IDEA model, resemble solutions of a susceptible-infectious-removed (SIR) compartmental differential-equation model in an asymptotic limit, where the changes of disease transmission respond to control measures, and not only to the depletion of susceptible individuals. This suggests that the concept of the reproduction number (R0) was implicitly captured in Farr's (pre-microbial era) work, and also suggests that control of epidemics, whether via behavior change or intervention, is as integral to the natural history of epidemics as is the dynamics of disease transmission.