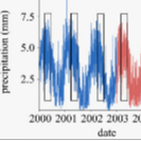
Transmission of dengue fever depends on a complex interplay of human, cli-mate and mosquito dynamics, which often change in time and space. It is wellknown that its disease dynamics are highly influenced by multiple factorsincluding population susceptibility to infection as well as by microclimates:small-area climatic conditions which create environments favourable for thebreeding and survival of mosquitoes. Here, we present a novel machine learn-ing dengue forecasting approach, which, dynamically in time and space,identifies local patterns in weather and population susceptibility to make epi-demic predictions at the city level in Brazil, months ahead of the occurrence ofdisease outbreaks. Weather-based predictions are improved when informationon population susceptibility is incorporated, indicating that immunity is animportant predictor neglected by most dengue forecast models. Given thegeneralizability of our methodology to any location or input data, it mayprove valuable for public health decision-making aimed at mitigating theeffects of seasonal dengue outbreaks in locations globally.
Objectives: To create a machine-learning model identifying potentially avoidable blood draws for serum potassium among pediatric patients following cardiac surgery. Design: Retrospective cohort study. Setting: Tertiary-care center. Patients: All patients admitted to the cardiac ICU at Boston Children’s Hospital between January 2010 and December 2018 with a length of stay greater than or equal to 4 days and greater than or equal to two recorded serum potassium measurements. Interventions: None. Measurements and Main Results: We collected variables related to potassium homeostasis, including serum chemistry, hourly potassium intake, diuretics, and urine output. Using established machine-learning techniques, including random forest classifiers, and hyperparameter tuning, we created models predicting whether a patient’s potassium would be normal or abnormal based on the most recent potassium level, medications administered, urine output, and markers of renal function. We developed multiple models based on different age-categories and temporal proximity of the most recent potassium measurement. We assessed the predictive performance of the models using an independent test set. Of the 7,269 admissions (6,196 patients) included, serum potassium was measured on average of 1 (interquartile range, 0–1) time per day. Approximately 96% of patients received at least one dose of IV diuretic and 83% received a form of potassium supplementation. Our models predicted a normal potassium value with a median positive predictive value of 0.900. A median percentage of 2.1% measurements (mean 2.5%; interquartile range, 1.3–3.7%) was incorrectly predicted as normal when they were abnormal. A median percentage of 0.0% (interquartile range, 0.0–0.4%) critically low or high measurements was incorrectly predicted as normal. A median of 27.2% (interquartile range, 7.8–32.4%) of samples was correctly predicted to be normal and could have been potentially avoided. Conclusions: Machine-learning methods can be used to predict avoidable blood tests accurately for serum potassium in critically ill pediatric patients. A median of 27.2% of samples could have been saved, with decreased costs and risk of infection or anemia.
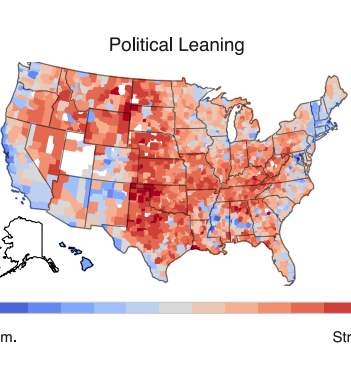
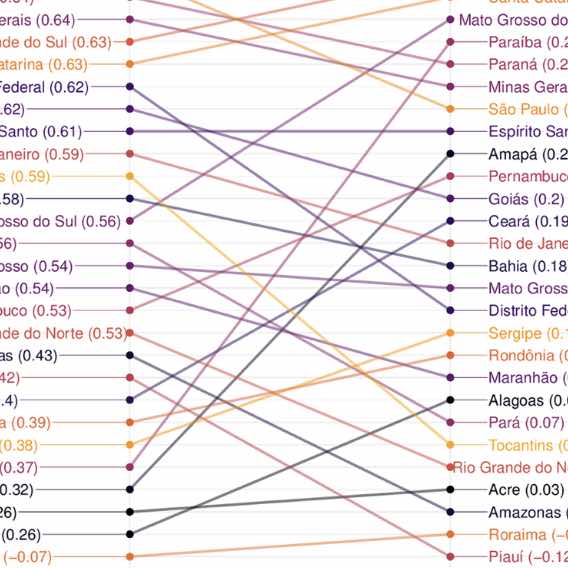
The COVID-19 pandemic has had intense, heterogeneous impacts on different communities and geographies in the United States. We explore county level associations between COVID-19 attributed deaths and social, demographic, vulnerability, and political variables to develop a better understanding of the evolving roles these variables play in relation to mortality. We focus on the role of political variables, as captured by support for either the Republican or Democrat presidential candidates in the 2020 elections and the stringency of state-wide governor mandates, during three non-overlapping time periods between February 2020 and February 2021. We find that during the first three months of the pandemic, Democratic-leaning and internationally-connected urban counties were affected. During subsequent months (between May and September, 2020), Republican counties with high percentages of Hispanic and Black populations were most hardly hit. Importantly, in the time period between October 2020 and February 2021, when the effectiveness of non-pharmaceutical interventions, such as social distancing and wearing masks indoors, had been well-established. During this period, we find that Republican-leaning counties experienced up to 3 times higher death rates than Democratic-leaning counties, even after controlling for multiple social vulnerability factors. We also find that Republican-leaning counties in states with less strict mandates experienced the most severe outbreaks. Our findings suggest that ideologies promoted by prominent political actors may not align with efforts to mitigate the impact of the ongoing pandemic and prevent deaths.
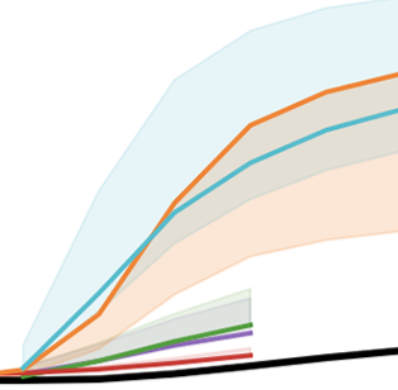
Time lags in reporting to national surveillance systems represent a major barrier for the control of infectious diseases, preventing timely decision making and resource allocation. This issue is particularly acute for infectious diseases like malaria, which often impact rural and remote communities the hardest. In Guyana, a country located in South America, poor connectivity among remote malaria-endemic regions hampers surveillance efforts, making reporting delays a key challenge for elimination. Here, we analyze 13 years of malaria surveillance data, identifying key correlates of time lags between clinical cases occurring and being added to the central data system. We develop nowcasting methods that use historical patterns of reporting delays to estimate occurred-but-not-reported monthly malaria cases. To assess their performance, we implemented them retrospectively, using only information that would have been available at the time of estimation, and found that they substantially enhanced the estimates of malaria cases. Specifically, we found that the best performing models achieved up to two-fold improvements in accuracy (or error reduction) over known cases in selected regions. Our approach provides a simple, generalizable tool to improve malaria surveillance in endemic countries and is currently being implemented to help guide existing resource allocation and elimination efforts.
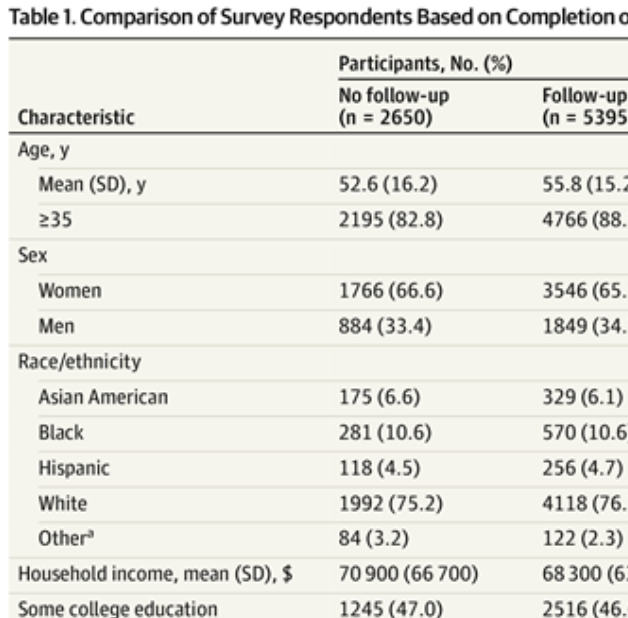
ImportanceSome studies suggest that social media use is associated with risk for depression, particularly among children and young adults. ObjectiveTo characterize the association between self-reported use of individual social media platforms and worsening of depressive symptoms among adults. Design, Setting, and ParticipantsThis survey study included data from 13 waves of a nonprobability internet survey conducted approximately monthly between May 2020 and May 2021 among individuals aged 18 years and older in the US. Data were analyzed in July and August 2021. Main Outcomes and MeasuresLogistic regression was applied without reweighting, with a 5 point or greater increase in 9-item Patient Health Questionnaire (PHQ-9) score as outcome and participant sociodemographic features, baseline PHQ-9, and use of each social media platform as independent variables. ResultsIn total, 5395 of 8045 individuals (67.1%) with a PHQ-9 score below 5 on initial survey completed a second PHQ-9. These respondents had a mean (SD) age of 55.8 (15.2) years; 3546 respondents (65.7%) identified as female; 329 respondents (6.1%) were Asian, 570 (10.6%) Black, 256 (4.7%) Hispanic, 4118 (76.3%) White, and 122 (2.3%) American Indian or Alaska Native, Pacific Islander or Native Hawaiian, or other. Among eligible respondents, 482 (8.9%) reported 5 points or greater worsening of PHQ-9 score at second survey. In fully adjusted models for increase in symptoms, the largest adjusted odds ratio (aOR) associated with social media use was observed for Snapchat (aOR, 1.53; 95% CI, 1.19-1.96), Facebook (aOR, 1.42; 95% CI, 1.10-1.81), and TikTok (aOR, 1.39; 95% CI, 1.03-1.87). Conclusions and RelevanceAmong survey respondents who did not report depressive symptoms initially, social media use was associated with greater likelihood of subsequent increase in depressive symptoms after adjustment for sociodemographic features and news sources. These data cannot elucidate the nature of this association, but suggest the need for further study to understand how social media use may factor into depression among adults.
Gender‐specificity of resilience in major depressive disorder Roy H Perlis, Katherine Ognyanova, Alexi Quintana, Jon Green, Mauricio Santillana, Jennifer Lin, James Druckman, David Lazer, Matthew D Simonson, Matthew A Baum, Hanyu Chwe. Depression and anxiety 38 (10), 1026-103322021
Abstract
IntroductionThe major stressors associated with the COVID-19 pandemic provide an opportunity to understand the extent to which protective factors against depression may exhibit gender-specificity. MethodThis study examined responses from multiple waves of a 50 states non-probability internet survey conducted between May 2020 and January 2021. Participants completed the PHQ-9 as a measure of depression, as well as items characterizing social supports. We used logistic regression models with population reweighting to examine association between absence of even mild depressive symptoms and sociodemographic features and social supports, with interaction terms and stratification used to investigate sex-specificity. ResultsAmong 73,917 survey respondents, 31,199 (42.2%) reported absence of mild or greater depression—11,011/23,682 males (46.5%) and 20,188/50,235 (40.2%) females. In a regression model, features associated with greater likelihood of depression-resistance included at least weekly attendance of religious services (odds ratio [OR]: 1.10, 95% confidence interval [CI]: 1.04–1.16) and greater trust in others (OR: 1.04 for a 2-unit increase, 95% CI: 1.02–1.06), along with level of social support measured as number of social ties available who could provide care (OR: 1.05, 95% CI: 1.02–1.07), talk to them (OR: 1.10, 95% CI: 1.07–1.12), and help with employment (OR: 1.06, 95% CI: 1.04–1.08). The first two features showed significant interaction with gender (p < .0001), with markedly greater protective effects among women. ConclusionAspects of social support are associated with diminished risk of major depressive symptoms, with greater effects of religious service attendance and trust in others observed among women than men.
We present an interpretable high-resolution spatio-temporal model to estimate COVID-19 deaths together with confirmed cases 1 week ahead of the current time, at the county level and weekly aggregated, in the United States. A notable feature of our spatio-temporal model is that it considers the (1) temporal auto- and pairwise correlation of the two local time series (confirmed cases and deaths from the COVID-19), (2) correlation between locations (propagation between counties), and (3) covariates such as local within-community mobility and social demographic factors. The within-community mobility and demographic factors, such as total population and the proportion of the elderly, are included as important predictors since they are hypothesized to be important in determining the dynamics of COVID-19. To reduce the model’s high dimensionality, we impose sparsity structures as constraints and emphasize the impact of the top 10 metropolitan areas in the nation, which we refer to (and treat within our models) as hubs in spreading the disease. Our retrospective out-of-sample county-level predictions were able to forecast the subsequently observed COVID-19 activity accurately. The proposed multivariate predictive models were designed to be highly interpretable, with clear identification and quantification of the most important factors that determine the dynamics of COVID-19. Ongoing work involves incorporating more covariates, such as education and income, to improve prediction accuracy and model interpretability.
Concerns about misperceptions among the public are rampant. Yet, little work explores the correlates of misperceptions in varying contexts – that is, how do factors such as group affiliations, media exposure, and lived experiences correlate with the number of misperceptions people hold? We address these questions by investigating misperceptions about COVID-19, focusing on the role of racial/ethnic, religious, and partisan groups. Using a large survey, we find the number of correct beliefs held by individuals far dwarfs the number of misperceptions. When it comes to misperceptions, we find that minorities, those with high levels of religiosity, and those with strong partisan identities – across parties – hold a substantially greater number of misperceptions than those with contrasting group affiliations. Moreover, we show other variables (e.g., social media usage, number of COVID-19 cases in one’s county) do not have such strong relationships with misperceptions, and the group-level results do not reflect acquiescence to believing any information regardless of its truth value. Our results accentuate the importance of studying group-level misperceptions on other scientific and political issues and developing targeted interventions for these groups.
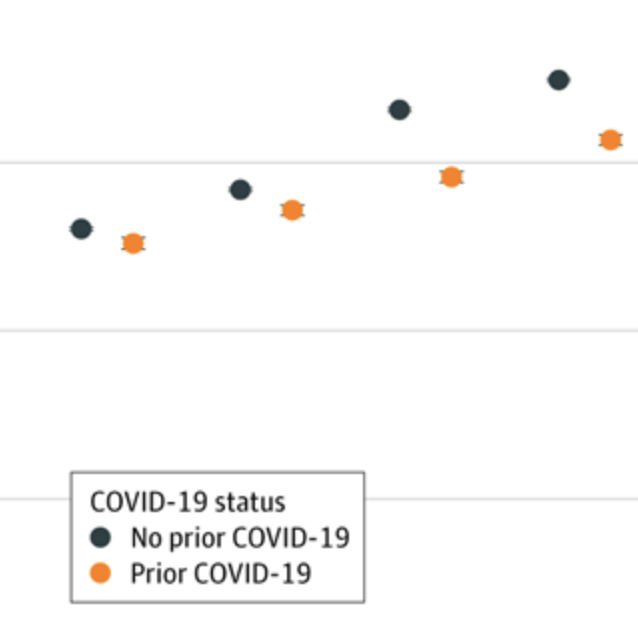
Rates of major depressive symptoms are elevated after acute infection with SARS-CoV-2.1-3 A key question is whether such symptoms represent a general consequence of stress associated with acute illness or whether they reflect more specific sequelae associated with COVID-19 pathophysiology itself. To examine this possibility, in this survey study, we compared features of major depression in individuals with or without prior COVID-19 illness.
Dengue virus remains a significant public health challenge in Brazil, and seasonal preparation efforts are hindered by variable intra- and interseasonal dynamics. Here, we present a framework for characterizing weekly dengue activity at the Brazilian mesoregion level from 2010–2016 as time series properties that are relevant to forecasting efforts, focusing on outbreak shape, seasonal timing, and pairwise correlations in magnitude and onset. In addition, we use a combination of 18 satellite remote sensing imagery, weather, clinical, mobility, and census data streams and regression methods to identify a parsimonious set of covariates that explain each time series property. The models explained 54% of the variation in outbreak shape, 38% of seasonal onset, 34% of pairwise correlation in outbreak timing, and 11% of pairwise correlation in outbreak magnitude. Regions that have experienced longer periods of drought sensitivity, as captured by the “normalized burn ratio,” experienced less intense outbreaks, while regions with regular fluctuations in relative humidity had less regular seasonal outbreaks. Both the pairwise correlations in outbreak timing and outbreak trend between mesoresgions were best predicted by distance. Our analysis also revealed the presence of distinct geographic clusters where dengue properties tend to be spatially correlated. Forecasting models aimed at predicting the dynamics of dengue activity need to identify the most salient variables capable of contributing to accurate predictions. Our findings show that successful models may need to leverage distinct variables in different locations and be catered to a specific task, such as predicting outbreak magnitude or timing characteristics, to be useful. This advocates in favor of “adaptive models” rather than “one-size-fits-all” models. The results of this study can be applied to improving spatial hierarchical or target-focused forecasting models of dengue activity across Brazil.
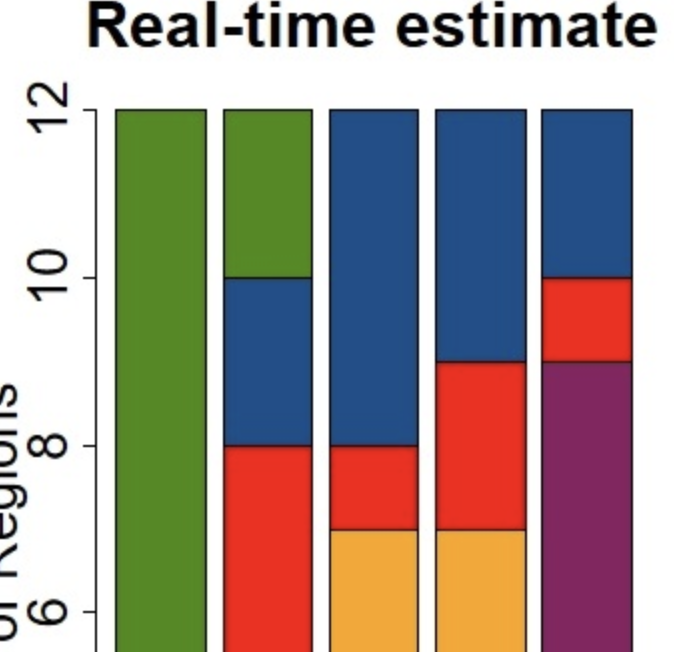
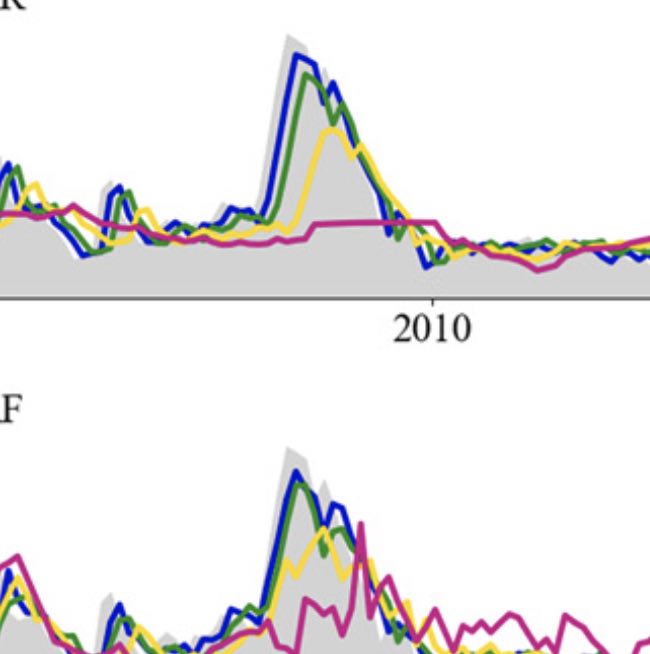
Effective and timely disease surveillance systems have the potential to help public health officials design interventions to mitigate the effects of disease outbreaks. Currently, healthcare-based disease monitoring systems in France offer influenza activity information that lags real-time by one to three weeks. This temporal data gap introduces uncertainty that prevents public health officials from having a timely perspective on the population-level disease activity. Here, we present a machine-learning modeling approach that produces real-time estimates and short-term forecasts of influenza activity for the twelve continental regions of France by leveraging multiple disparate data sources that include, Google search activity, real-time and local weather information, flu-related Twitter micro-blogs, electronic health records data, and historical disease activity synchronicities across regions. Our results show that all data sources contribute to improving influenza surveillance and that machine-learning ensembles that combine all data sources lead to accurate and timely predictions.
Background:During the COVID-19 pandemic rates of depressive symptoms are markedly elevated, particularly among survivors of infection. Understanding whether such symptoms are distinct among those with prior SARS-CoV-2 infection, or simply a nonspecific reflection of elevated stress, could help target interventions. Method:We analyzed data from multiple waves of a 50-state survey that included questions about COVID-19 infection as well as the Patient Health Questionnaire examining depressive and anxious symptoms. We utilized multiple logistic regression to examine whether sociodemographic features associated with depression liability differed for those with or without prior COVID-19, and then whether depressive symptoms differed among those with or without prior COVID-19. Results:Among 91,791 respondents, in regression models, age, gender, race, education, and income all exhibited an interaction with prior COVID-19 in risk for moderate or greater depressive symptoms (p<0.0001 in all cases), indicating differential risk in the two subgroups. Among those with such symptoms, levels of motoric symptoms and suicidality were significantly greater among those with prior COVID-19 illness. Depression risk increased with greater interval following acute infection.
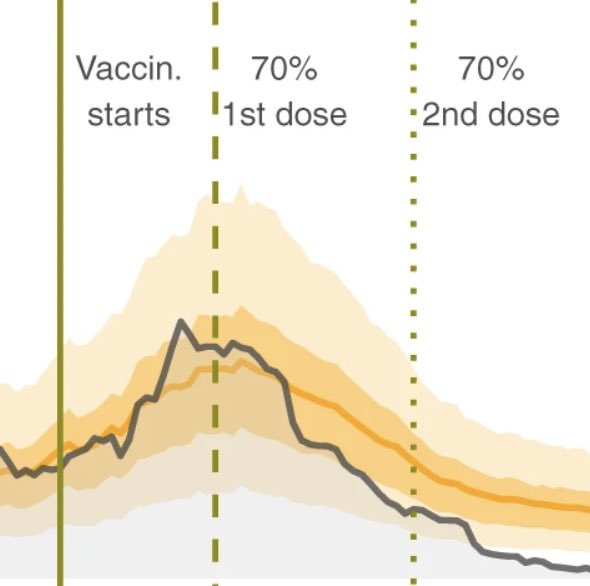
Background Residents of Long-Term Care Facilities (LTCFs) represent a major share of COVID-19 deaths worldwide. Measuring the vaccine effectiveness among the most vulnerable in these settings is essential to monitor and improve mitigation strategies. Methods We evaluate the early effect of the administration of BNT162b2-mRNA vaccine to individuals older than 64 years residing in LTCFs in Catalonia, Spain. We monitor all the SARS-CoV-2 documented infections and deaths among LTCFs residents once more than 70% of them were fully vaccinated (February–March 2021). We develop a modeling framework based on the relationship between community and LTCFs transmission during the pre-vaccination period (July–December 2020). We compute the total reduction in SARS-CoV-2 documented infections and deaths among residents of LTCFs over time, as well as the reduction in the detected transmission for all the LTCFs. We compare the true observations with the counterfactual predictions.
Results We estimate that once more than 70% of the LTCFs population are fully vaccinated, 74% (58–81%, 90% CI) of COVID-19 deaths and 75% (36–86%, 90% CI) of all expected documented infections among LTCFs residents are prevented. Further, detectable transmission among LTCFs residents is reduced up to 90% (76–93%, 90% CI) relative to that expected given transmission in the community.
Conclusions Our findings provide evidence that high-coverage vaccination is the most effective intervention to prevent SARS-CoV-2 transmission and death among LTCFs residents. Widespread vaccination could be a feasible avenue to control the COVID-19 pandemic conditional on key factors such as vaccine escape, roll out and coverage.
After acute infection with severe acute respiratory syndrome coronavirus 2 (SARS-CoV-2), a subset of individuals experience persistent symptoms involving mood, sleep, anxiety, and fatigue,1 which may contribute to markedly elevated rates of major depressive disorder observed in recent epidemiologic studies.2 In this study, we investigated whether acute coronavirus disease 2019 (COVID-19) symptoms are associated with the probability of subsequent depressive symptoms.
Atmospheric composition plays a crucial role in determining the evolution of the atmosphere, but the high computational cost has been the major barrier to include atmospheric chemistry into Earth system models. Here we present an adaptive and efficient algorithm that can remove this barrier. Our approach is inspired by unsupervised machine learning clustering techniques and traditional asymptotic analysis ideas. We first partition species into 13 blocks, using a novel machine learning approach that analyzes the species network structures and their production and loss rates. Building on these 15 blocks, we pre-select 20 submechanisms, as defined by unique assemblages of the species blocks, and then pick locally on the fly which submechanism to use based on local chemical conditions. In each submechanism, we isolate slow species and unimportant reactions from the coupled system. Application to a global 3-D model shows that we can cut the computational costs of the chemical integration by 50% with accuracy losses smaller than 1% that do not propagate in time. Tests show that this algorithm is highly chemically coherent making it easily portable to new models without compromising its performance. 20 Our algorithm will significantly ease the computational bottleneck and will facilitate the development of next generation of earth system models.
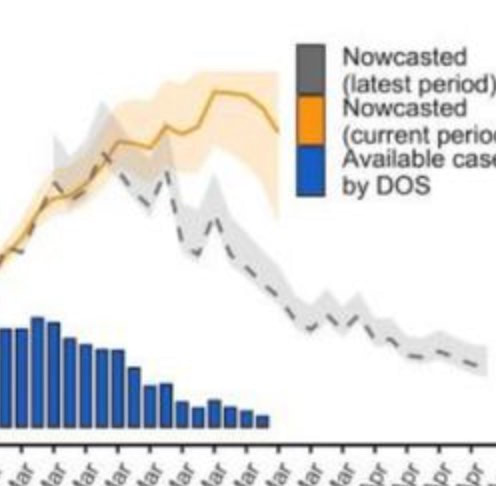
Designing public health responses to outbreaks requires close monitoring of population-level health indicators in real-time. Thus, an accurate estimation of the epidemic curve is critical. We propose an approach to reconstruct epidemic curves in near real time. We apply this approach to characterize the early SARS-CoV-2 outbreak in two Spanish regions between March and April 2020. We address two data collection problems that affected the reliability of the available real-time epidemiological data, namely, the frequent missing information documenting when a patient first experienced symptoms, and the frequent retrospective revision of historical information (including right censoring). This is done by using a novel back-calculating procedure based on imputing patients’ dates of symptom onset from reported cases, according to a dynamically-estimated “backward” reporting delay conditional distribution, and adjusting for right censoring using an existing package, NobBS, to estimate in real time (nowcast) cases by date of symptom onset. This process allows us to obtain an approximation of the time-varying reproduction number (Rt) in real-time. At each step, we evaluate how different assumptions affect the recovered epidemiological events and compare the proposed approach to the alternative procedure of merely using curves of case counts, by report day, to characterize the time-evolution of the outbreak. Finally, we assess how these real-time estimates compare with subsequently documented epidemiological information that is considered more reliable and complete that became available later in time. Our approach may help improve accuracy, quantify uncertainty, and evaluate frequently unstated assumptions when recovering the epidemic curves from limited data obtained from public health surveillance systems in other locations.
The COVID-19 crisis has exposed major inequalities between communities. Understanding the societal risk factors that make some groups particularly vulnerable is essential to ensure more effective interventions for this and future pandemics. Here, we focus on socioeconomic status as a risk factor. Although it is broadly understood that social and economic inequality has a negative impact on health outcomes, the mechanisms by which socioeconomic status affects disease outcomes remain unclear. These mechanisms can be mediated by a range of systemic structural factors, such as access to health care and economic safety nets. We address this gap by providing an in-depth characterization of disease incidence and mortality and their dependence on demographic and socioeconomic strata in Santiago, a highly segregated city and the capital of Chile.
Over 390 million people worldwide are infected with dengue fever each year. In the absence of an effective vaccine for general use, national control programs must rely on hospital readiness and targeted vector control to prepare for epidemics, so accurate forecasting remains an important goal. Many dengue forecasting approaches have used environmental data linked to mosquito ecology to predict when epidemics will occur, but these have had mixed results. Conversely, human mobility, an important driver in the spatial spread of infection, is often ignored. Here we compare time-series forecasts of dengue fever in Thailand, integrating epidemiological data with mobility models generated from mobile phone data. We show that geographically-distant provinces strongly connected by human travel have more highly correlated dengue incidence than weakly connected provinces of the same distance, and that incorporating mobility data improves traditional time-series forecasting approaches. Notably, no single model or class of model always outperformed others. We propose an adaptive, mosaic forecasting approach for early warning systems.
Importance: COVID-19 symptoms are increasingly recognized to persist among a subset of individual following acute infection, but features associated with this persistence are not well-understood. Objective: We aimed to identify individual features that predicted persistence of symptoms over at least 2 months at the time of survey completion. Design: Non-probability internet survey. Participants were asked to identify features of acute illness as well as persistence of symptoms at time of study completion. We used logistic regression models to examine association between sociodemographic and clinical features and persistence of symptoms at or beyond 2 months.
Given still-high levels of coronavirus disease 2019 (COVID-19) susceptibility and inconsistent transmission-containing strategies, outbreaks have continued to emerge across the United States. Until effective vaccines are widely deployed, curbing COVID-19 will require carefully timed nonpharmaceutical interventions (NPIs). A COVID-19 early warning system is vital for this. Here, we evaluate digital data streams as early indicators of state-level COVID-19 activity from 1 March to 30 September 2020. We observe that increases in digital data stream activity anticipate increases in confirmed cases and deaths by 2 to 3 weeks. Confirmed cases and deaths also decrease 2 to 4 weeks after NPI implementation, as measured by anonymized, phone-derived human mobility data. We propose a means of harmonizing these data streams to identify future COVID-19 outbreaks. Our results suggest that combining disparate health and behavioral data may help identify disease activity changes weeks before observation using traditional epidemiological monitoring.
Effectively designing and evaluating public health responses to the ongoing COVID-19 pandemic requires accurate estimation of the prevalence of COVID-19 across the United States (US). Equipment shortages and varying testing capabilities have however hindered the usefulness of the official reported positive COVID-19 case counts. We introduce four complementary approaches to estimate the cumulative incidence of symptomatic COVID-19 in each state in the US as well as Puerto Rico and the District of Columbia, using a combination of excess influenza-like illness reports, COVID-19 test statistics, COVID-19 mortality reports, and a spatially structured epidemic model. Instead of relying on the estimate from a single data source or method that may be biased, we provide multiple estimates, each relying on different assumptions and data sources. Across our four approaches emerges the consistent conclusion that on April 4, 2020, the estimated case count was 5 to 50 times higher than the official positive test counts across the different states. Nationally, our estimates of COVID-19 symptomatic cases as of April 4 have a likely range of 2.3 to 4.8 million, with possibly as many as 7.6 million cases, up to 25 times greater than the cumulative confirmed cases of about 311,000. Extending our methods to May 16, 2020, we estimate that cumulative symptomatic incidence ranges from 4.9 to 10.1 million, as opposed to 1.5 million positive test counts. The proposed combination of approaches may prove useful in assessing the burden of COVID-19 during resurgences in the US and other countries with comparable surveillance systems.
Mitigating the effects of disease outbreaks with timely and effective interventions requires accurate real-time surveillance and forecasting of disease activity, but traditional health care–based surveillance systems are limited by inherent reporting delays. Machine learning methods have the potential to fill this temporal “data gap,” but work to date in this area has focused on relatively simple methods and coarse geographic resolutions (state level and above). We evaluate the predictive performance of a gated recurrent unit neural network approach in comparison with baseline machine learning methods for estimating influenza activity in the United States at the state and city levels and experiment with the inclusion of real-time Internet search data. We find that the neural network approach improves upon baseline models for long time horizons of prediction but is not improved by real-time internet search data. We conduct a thorough analysis of feature importances in all considered models for interpretability purposes.